Immigrants from Somalia vs Immigrants from Fiji Householder Income Over 65 years
COMPARE
Immigrants from Somalia
Immigrants from Fiji
Householder Income Over 65 years
Householder Income Over 65 years Comparison
Immigrants from Somalia
Immigrants from Fiji
$53,333
HOUSEHOLDER INCOME OVER 65 YEARS
0.0/ 100
METRIC RATING
296th/ 347
METRIC RANK
$64,795
HOUSEHOLDER INCOME OVER 65 YEARS
98.2/ 100
METRIC RATING
82nd/ 347
METRIC RANK
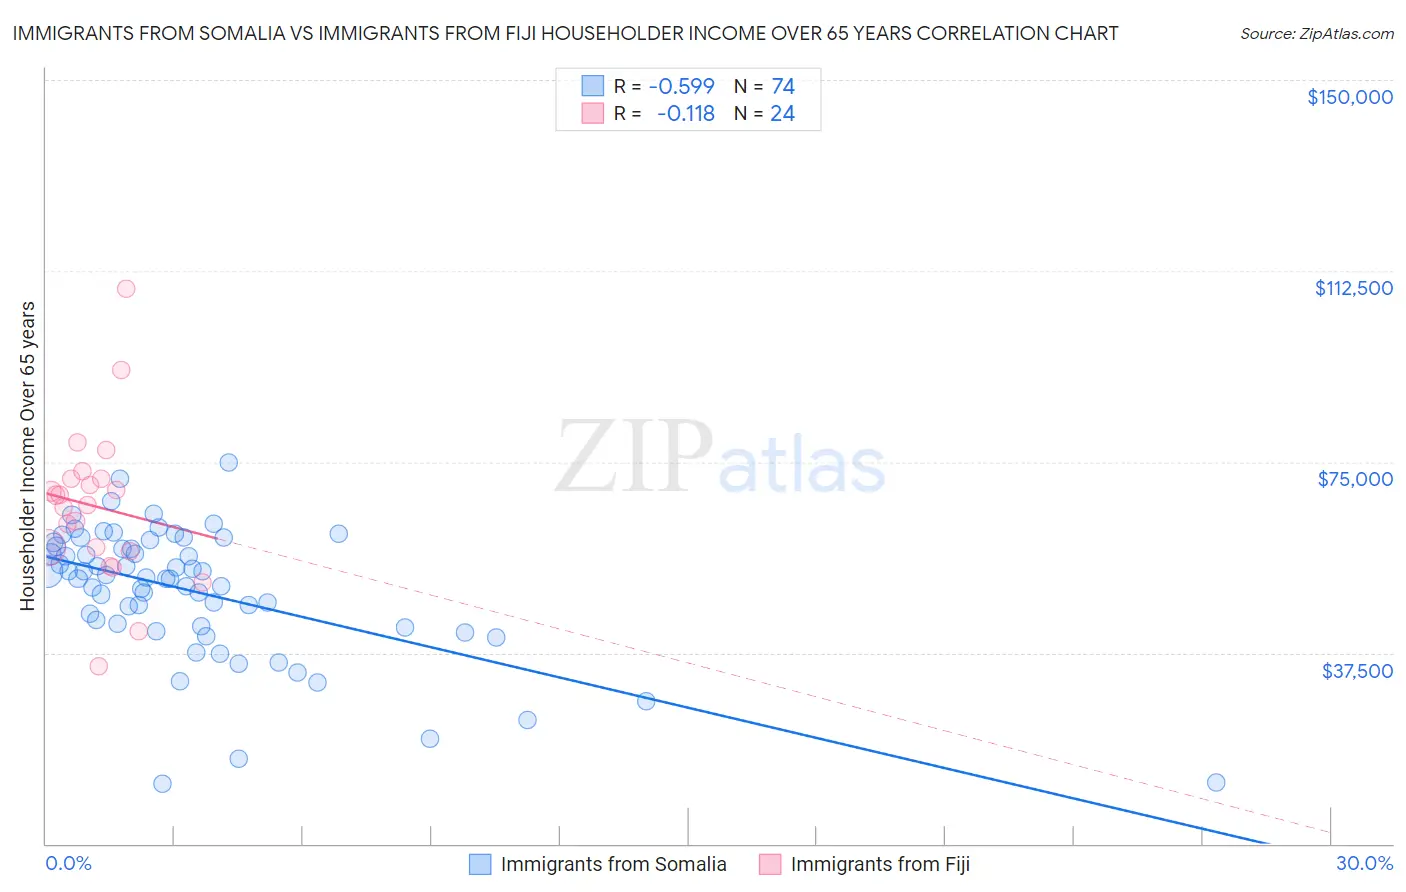
Immigrants from Somalia vs Immigrants from Fiji Householder Income Over 65 years Correlation Chart
The statistical analysis conducted on geographies consisting of 92,049,552 people shows a substantial negative correlation between the proportion of Immigrants from Somalia and household income with householder over the age of 65 in the United States with a correlation coefficient (R) of -0.599 and weighted average of $53,333. Similarly, the statistical analysis conducted on geographies consisting of 93,711,523 people shows a poor negative correlation between the proportion of Immigrants from Fiji and household income with householder over the age of 65 in the United States with a correlation coefficient (R) of -0.118 and weighted average of $64,795, a difference of 21.5%.
Householder Income Over 65 years Correlation Summary
| Measurement | Immigrants from Somalia | Immigrants from Fiji |
| Minimum | $11,897 | $34,792 |
| Maximum | $75,000 | $108,977 |
| Range | $63,103 | $74,185 |
| Mean | $49,499 | $66,250 |
| Median | $52,194 | $67,555 |
| Interquartile 25% (IQ1) | $42,667 | $57,741 |
| Interquartile 75% (IQ3) | $58,367 | $71,770 |
| Interquartile Range (IQR) | $15,700 | $14,029 |
| Standard Deviation (Sample) | $12,933 | $15,202 |
| Standard Deviation (Population) | $12,845 | $14,882 |
Similar Demographics by Householder Income Over 65 years
Demographics Similar to Immigrants from Somalia by Householder Income Over 65 years
In terms of householder income over 65 years, the demographic groups most similar to Immigrants from Somalia are Immigrants from Latin America ($53,265, a difference of 0.13%), Immigrants from Central America ($53,420, a difference of 0.16%), Central American Indian ($53,232, a difference of 0.19%), Ottawa ($53,217, a difference of 0.22%), and Immigrants from Bahamas ($53,174, a difference of 0.30%).
| Demographics | Rating | Rank | Householder Income Over 65 years |
| Iroquois | 0.1 /100 | #289 | Tragic $53,737 |
| Chickasaw | 0.1 /100 | #290 | Tragic $53,732 |
| Africans | 0.0 /100 | #291 | Tragic $53,711 |
| Shoshone | 0.0 /100 | #292 | Tragic $53,681 |
| Immigrants | Belize | 0.0 /100 | #293 | Tragic $53,665 |
| Senegalese | 0.0 /100 | #294 | Tragic $53,591 |
| Immigrants | Central America | 0.0 /100 | #295 | Tragic $53,420 |
| Immigrants | Somalia | 0.0 /100 | #296 | Tragic $53,333 |
| Immigrants | Latin America | 0.0 /100 | #297 | Tragic $53,265 |
| Central American Indians | 0.0 /100 | #298 | Tragic $53,232 |
| Ottawa | 0.0 /100 | #299 | Tragic $53,217 |
| Immigrants | Bahamas | 0.0 /100 | #300 | Tragic $53,174 |
| Yuman | 0.0 /100 | #301 | Tragic $53,110 |
| Spanish American Indians | 0.0 /100 | #302 | Tragic $53,077 |
| Choctaw | 0.0 /100 | #303 | Tragic $53,060 |
Demographics Similar to Immigrants from Fiji by Householder Income Over 65 years
In terms of householder income over 65 years, the demographic groups most similar to Immigrants from Fiji are Immigrants from Europe ($64,828, a difference of 0.050%), Immigrants from North America ($64,856, a difference of 0.090%), Hawaiian ($64,920, a difference of 0.19%), Immigrants from Western Europe ($64,933, a difference of 0.21%), and Northern European ($64,658, a difference of 0.21%).
| Demographics | Rating | Rank | Householder Income Over 65 years |
| Sierra Leoneans | 98.6 /100 | #75 | Exceptional $65,038 |
| Ethiopians | 98.5 /100 | #76 | Exceptional $64,989 |
| Immigrants | Canada | 98.5 /100 | #77 | Exceptional $64,952 |
| Immigrants | Western Europe | 98.5 /100 | #78 | Exceptional $64,933 |
| Hawaiians | 98.4 /100 | #79 | Exceptional $64,920 |
| Immigrants | North America | 98.3 /100 | #80 | Exceptional $64,856 |
| Immigrants | Europe | 98.3 /100 | #81 | Exceptional $64,828 |
| Immigrants | Fiji | 98.2 /100 | #82 | Exceptional $64,795 |
| Northern Europeans | 97.9 /100 | #83 | Exceptional $64,658 |
| Immigrants | Greece | 97.9 /100 | #84 | Exceptional $64,636 |
| Immigrants | Lebanon | 97.6 /100 | #85 | Exceptional $64,521 |
| Immigrants | Russia | 97.6 /100 | #86 | Exceptional $64,512 |
| Austrians | 97.5 /100 | #87 | Exceptional $64,470 |
| Immigrants | Romania | 97.5 /100 | #88 | Exceptional $64,462 |
| Paraguayans | 97.4 /100 | #89 | Exceptional $64,443 |