Immigrants from Somalia vs Guamanian/Chamorro Family Poverty
COMPARE
Immigrants from Somalia
Guamanian/Chamorro
Family Poverty
Family Poverty Comparison
Immigrants from Somalia
Guamanians/Chamorros
11.5%
FAMILY POVERTY
0.0/ 100
METRIC RATING
292nd/ 347
METRIC RANK
8.8%
FAMILY POVERTY
64.7/ 100
METRIC RATING
165th/ 347
METRIC RANK
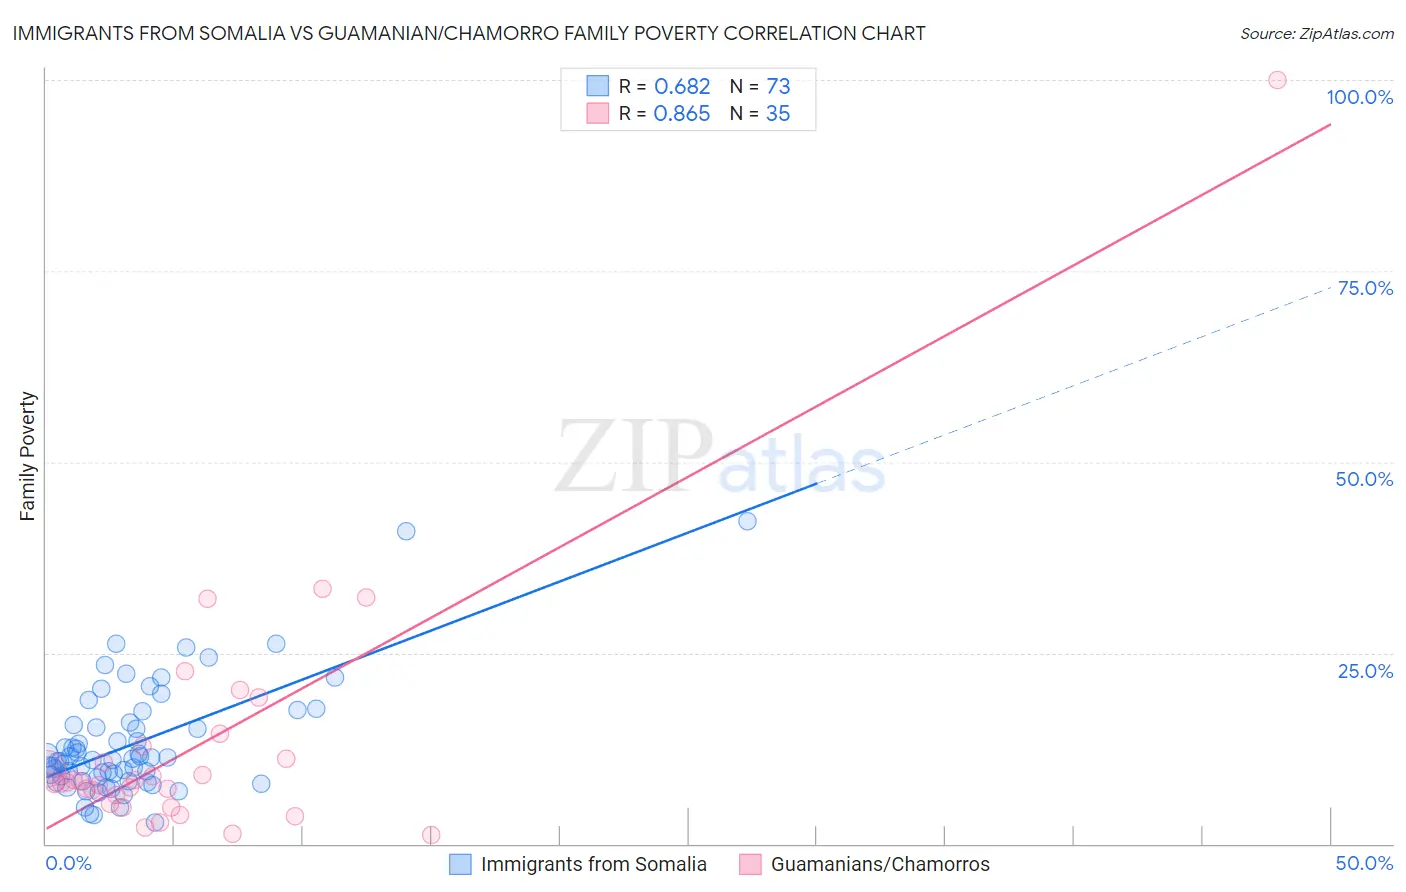
Immigrants from Somalia vs Guamanian/Chamorro Family Poverty Correlation Chart
The statistical analysis conducted on geographies consisting of 92,063,103 people shows a significant positive correlation between the proportion of Immigrants from Somalia and poverty level among families in the United States with a correlation coefficient (R) of 0.682 and weighted average of 11.5%. Similarly, the statistical analysis conducted on geographies consisting of 221,737,995 people shows a very strong positive correlation between the proportion of Guamanians/Chamorros and poverty level among families in the United States with a correlation coefficient (R) of 0.865 and weighted average of 8.8%, a difference of 30.8%.
Family Poverty Correlation Summary
| Measurement | Immigrants from Somalia | Guamanian/Chamorro |
| Minimum | 2.7% | 1.2% |
| Maximum | 42.2% | 100.0% |
| Range | 39.5% | 98.8% |
| Mean | 13.1% | 13.1% |
| Median | 11.0% | 8.0% |
| Interquartile 25% (IQ1) | 8.5% | 5.2% |
| Interquartile 75% (IQ3) | 15.7% | 12.7% |
| Interquartile Range (IQR) | 7.2% | 7.5% |
| Standard Deviation (Sample) | 7.4% | 17.3% |
| Standard Deviation (Population) | 7.3% | 17.1% |
Similar Demographics by Family Poverty
Demographics Similar to Immigrants from Somalia by Family Poverty
In terms of family poverty, the demographic groups most similar to Immigrants from Somalia are Haitian (11.5%, a difference of 0.11%), West Indian (11.5%, a difference of 0.17%), Immigrants from Barbados (11.5%, a difference of 0.18%), Immigrants from Belize (11.5%, a difference of 0.22%), and Vietnamese (11.5%, a difference of 0.42%).
| Demographics | Rating | Rank | Family Poverty |
| Barbadians | 0.0 /100 | #285 | Tragic 11.3% |
| Senegalese | 0.0 /100 | #286 | Tragic 11.5% |
| Vietnamese | 0.0 /100 | #287 | Tragic 11.5% |
| Immigrants | Belize | 0.0 /100 | #288 | Tragic 11.5% |
| Immigrants | Barbados | 0.0 /100 | #289 | Tragic 11.5% |
| West Indians | 0.0 /100 | #290 | Tragic 11.5% |
| Haitians | 0.0 /100 | #291 | Tragic 11.5% |
| Immigrants | Somalia | 0.0 /100 | #292 | Tragic 11.5% |
| Immigrants | Cabo Verde | 0.0 /100 | #293 | Tragic 11.6% |
| Immigrants | St. Vincent and the Grenadines | 0.0 /100 | #294 | Tragic 11.6% |
| Immigrants | Haiti | 0.0 /100 | #295 | Tragic 11.6% |
| Choctaw | 0.0 /100 | #296 | Tragic 11.6% |
| Creek | 0.0 /100 | #297 | Tragic 11.7% |
| Immigrants | Senegal | 0.0 /100 | #298 | Tragic 11.7% |
| Dutch West Indians | 0.0 /100 | #299 | Tragic 11.7% |
Demographics Similar to Guamanians/Chamorros by Family Poverty
In terms of family poverty, the demographic groups most similar to Guamanians/Chamorros are Celtic (8.8%, a difference of 0.030%), Afghan (8.8%, a difference of 0.18%), Pennsylvania German (8.8%, a difference of 0.19%), Ethiopian (8.8%, a difference of 0.24%), and Immigrants from Ethiopia (8.9%, a difference of 0.32%).
| Demographics | Rating | Rank | Family Poverty |
| Whites/Caucasians | 69.1 /100 | #158 | Good 8.8% |
| Peruvians | 68.0 /100 | #159 | Good 8.8% |
| Hungarians | 67.2 /100 | #160 | Good 8.8% |
| Immigrants | Northern Africa | 66.9 /100 | #161 | Good 8.8% |
| Ethiopians | 66.3 /100 | #162 | Good 8.8% |
| Pennsylvania Germans | 66.0 /100 | #163 | Good 8.8% |
| Celtics | 64.9 /100 | #164 | Good 8.8% |
| Guamanians/Chamorros | 64.7 /100 | #165 | Good 8.8% |
| Afghans | 63.5 /100 | #166 | Good 8.8% |
| Immigrants | Ethiopia | 62.5 /100 | #167 | Good 8.9% |
| Israelis | 62.1 /100 | #168 | Good 8.9% |
| Immigrants | Chile | 59.6 /100 | #169 | Average 8.9% |
| Kenyans | 58.2 /100 | #170 | Average 8.9% |
| Lebanese | 57.6 /100 | #171 | Average 8.9% |
| Immigrants | Peru | 57.5 /100 | #172 | Average 8.9% |