Immigrants from Somalia vs Immigrants from Germany Family Poverty
COMPARE
Immigrants from Somalia
Immigrants from Germany
Family Poverty
Family Poverty Comparison
Immigrants from Somalia
Immigrants from Germany
11.5%
FAMILY POVERTY
0.0/ 100
METRIC RATING
292nd/ 347
METRIC RANK
8.5%
FAMILY POVERTY
83.3/ 100
METRIC RATING
143rd/ 347
METRIC RANK
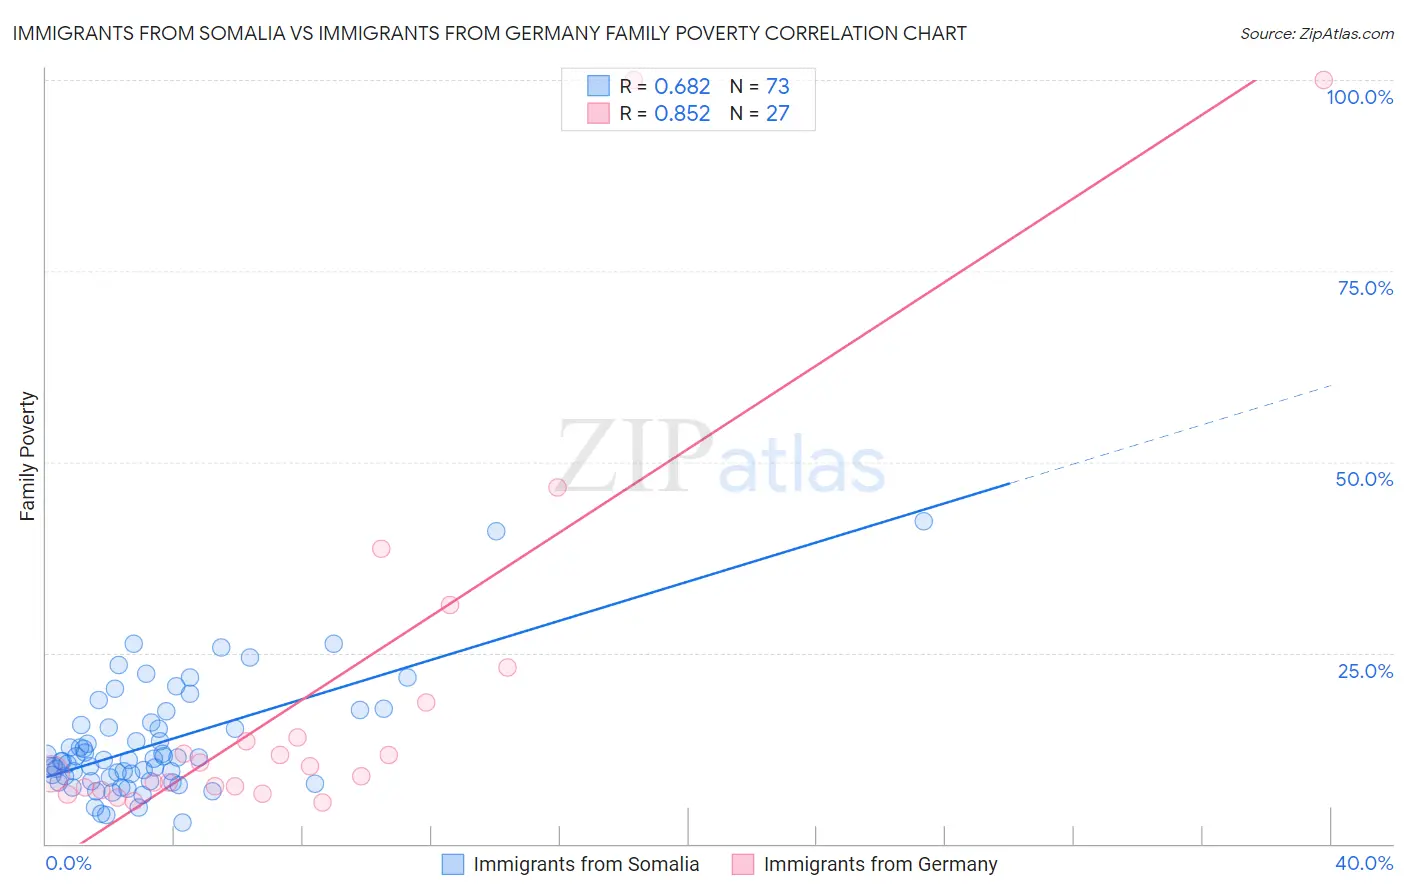
Immigrants from Somalia vs Immigrants from Germany Family Poverty Correlation Chart
The statistical analysis conducted on geographies consisting of 92,063,103 people shows a significant positive correlation between the proportion of Immigrants from Somalia and poverty level among families in the United States with a correlation coefficient (R) of 0.682 and weighted average of 11.5%. Similarly, the statistical analysis conducted on geographies consisting of 462,312,893 people shows a very strong positive correlation between the proportion of Immigrants from Germany and poverty level among families in the United States with a correlation coefficient (R) of 0.852 and weighted average of 8.5%, a difference of 35.3%.
Family Poverty Correlation Summary
| Measurement | Immigrants from Somalia | Immigrants from Germany |
| Minimum | 2.7% | 5.4% |
| Maximum | 42.2% | 100.0% |
| Range | 39.5% | 94.6% |
| Mean | 13.1% | 19.8% |
| Median | 11.0% | 10.2% |
| Interquartile 25% (IQ1) | 8.5% | 7.3% |
| Interquartile 75% (IQ3) | 15.7% | 18.4% |
| Interquartile Range (IQR) | 7.2% | 11.1% |
| Standard Deviation (Sample) | 7.4% | 25.3% |
| Standard Deviation (Population) | 7.3% | 24.8% |
Similar Demographics by Family Poverty
Demographics Similar to Immigrants from Somalia by Family Poverty
In terms of family poverty, the demographic groups most similar to Immigrants from Somalia are Haitian (11.5%, a difference of 0.11%), West Indian (11.5%, a difference of 0.17%), Immigrants from Barbados (11.5%, a difference of 0.18%), Immigrants from Belize (11.5%, a difference of 0.22%), and Vietnamese (11.5%, a difference of 0.42%).
| Demographics | Rating | Rank | Family Poverty |
| Barbadians | 0.0 /100 | #285 | Tragic 11.3% |
| Senegalese | 0.0 /100 | #286 | Tragic 11.5% |
| Vietnamese | 0.0 /100 | #287 | Tragic 11.5% |
| Immigrants | Belize | 0.0 /100 | #288 | Tragic 11.5% |
| Immigrants | Barbados | 0.0 /100 | #289 | Tragic 11.5% |
| West Indians | 0.0 /100 | #290 | Tragic 11.5% |
| Haitians | 0.0 /100 | #291 | Tragic 11.5% |
| Immigrants | Somalia | 0.0 /100 | #292 | Tragic 11.5% |
| Immigrants | Cabo Verde | 0.0 /100 | #293 | Tragic 11.6% |
| Immigrants | St. Vincent and the Grenadines | 0.0 /100 | #294 | Tragic 11.6% |
| Immigrants | Haiti | 0.0 /100 | #295 | Tragic 11.6% |
| Choctaw | 0.0 /100 | #296 | Tragic 11.6% |
| Creek | 0.0 /100 | #297 | Tragic 11.7% |
| Immigrants | Senegal | 0.0 /100 | #298 | Tragic 11.7% |
| Dutch West Indians | 0.0 /100 | #299 | Tragic 11.7% |
Demographics Similar to Immigrants from Germany by Family Poverty
In terms of family poverty, the demographic groups most similar to Immigrants from Germany are Albanian (8.5%, a difference of 0.020%), Yugoslavian (8.5%, a difference of 0.030%), Immigrants from South Eastern Asia (8.5%, a difference of 0.040%), Immigrants from Belarus (8.5%, a difference of 0.050%), and Immigrants from Jordan (8.5%, a difference of 0.080%).
| Demographics | Rating | Rank | Family Poverty |
| Immigrants | Brazil | 86.3 /100 | #136 | Excellent 8.5% |
| Immigrants | Southern Europe | 86.0 /100 | #137 | Excellent 8.5% |
| Armenians | 84.6 /100 | #138 | Excellent 8.5% |
| Immigrants | Nepal | 84.2 /100 | #139 | Excellent 8.5% |
| Immigrants | Kazakhstan | 84.1 /100 | #140 | Excellent 8.5% |
| Immigrants | Ukraine | 83.9 /100 | #141 | Excellent 8.5% |
| Yugoslavians | 83.5 /100 | #142 | Excellent 8.5% |
| Immigrants | Germany | 83.3 /100 | #143 | Excellent 8.5% |
| Albanians | 83.3 /100 | #144 | Excellent 8.5% |
| Immigrants | South Eastern Asia | 83.2 /100 | #145 | Excellent 8.5% |
| Immigrants | Belarus | 83.2 /100 | #146 | Excellent 8.5% |
| Immigrants | Jordan | 83.0 /100 | #147 | Excellent 8.5% |
| Scotch-Irish | 82.2 /100 | #148 | Excellent 8.6% |
| Mongolians | 80.4 /100 | #149 | Excellent 8.6% |
| Syrians | 80.3 /100 | #150 | Excellent 8.6% |