Armenian vs Guamanian/Chamorro Family Poverty
COMPARE
Armenian
Guamanian/Chamorro
Family Poverty
Family Poverty Comparison
Armenians
Guamanians/Chamorros
8.5%
FAMILY POVERTY
84.6/ 100
METRIC RATING
138th/ 347
METRIC RANK
8.8%
FAMILY POVERTY
64.7/ 100
METRIC RATING
165th/ 347
METRIC RANK
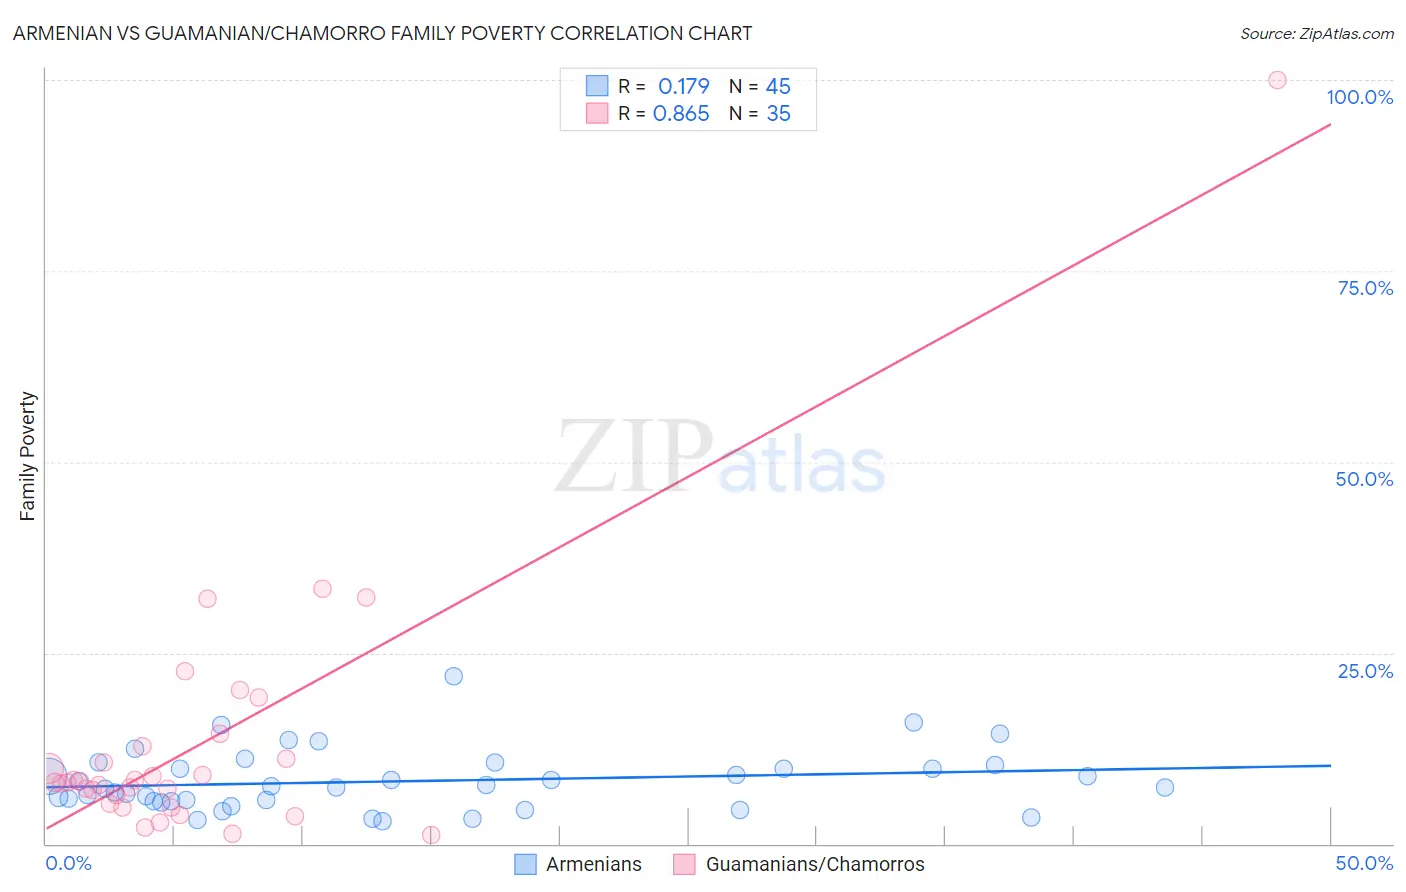
Armenian vs Guamanian/Chamorro Family Poverty Correlation Chart
The statistical analysis conducted on geographies consisting of 310,074,733 people shows a poor positive correlation between the proportion of Armenians and poverty level among families in the United States with a correlation coefficient (R) of 0.179 and weighted average of 8.5%. Similarly, the statistical analysis conducted on geographies consisting of 221,737,995 people shows a very strong positive correlation between the proportion of Guamanians/Chamorros and poverty level among families in the United States with a correlation coefficient (R) of 0.865 and weighted average of 8.8%, a difference of 3.8%.
Family Poverty Correlation Summary
| Measurement | Armenian | Guamanian/Chamorro |
| Minimum | 3.0% | 1.2% |
| Maximum | 22.0% | 100.0% |
| Range | 19.0% | 98.8% |
| Mean | 8.2% | 13.1% |
| Median | 7.4% | 8.0% |
| Interquartile 25% (IQ1) | 5.6% | 5.2% |
| Interquartile 75% (IQ3) | 10.1% | 12.7% |
| Interquartile Range (IQR) | 4.5% | 7.5% |
| Standard Deviation (Sample) | 4.0% | 17.3% |
| Standard Deviation (Population) | 3.9% | 17.1% |
Similar Demographics by Family Poverty
Demographics Similar to Armenians by Family Poverty
In terms of family poverty, the demographic groups most similar to Armenians are Immigrants from Nepal (8.5%, a difference of 0.12%), Immigrants from Kazakhstan (8.5%, a difference of 0.15%), Immigrants from Ukraine (8.5%, a difference of 0.18%), Yugoslavian (8.5%, a difference of 0.30%), and Immigrants from Germany (8.5%, a difference of 0.33%).
| Demographics | Rating | Rank | Family Poverty |
| Puget Sound Salish | 88.6 /100 | #131 | Excellent 8.4% |
| Immigrants | Argentina | 88.2 /100 | #132 | Excellent 8.4% |
| Sri Lankans | 86.6 /100 | #133 | Excellent 8.5% |
| Chileans | 86.6 /100 | #134 | Excellent 8.5% |
| Immigrants | Malaysia | 86.5 /100 | #135 | Excellent 8.5% |
| Immigrants | Brazil | 86.3 /100 | #136 | Excellent 8.5% |
| Immigrants | Southern Europe | 86.0 /100 | #137 | Excellent 8.5% |
| Armenians | 84.6 /100 | #138 | Excellent 8.5% |
| Immigrants | Nepal | 84.2 /100 | #139 | Excellent 8.5% |
| Immigrants | Kazakhstan | 84.1 /100 | #140 | Excellent 8.5% |
| Immigrants | Ukraine | 83.9 /100 | #141 | Excellent 8.5% |
| Yugoslavians | 83.5 /100 | #142 | Excellent 8.5% |
| Immigrants | Germany | 83.3 /100 | #143 | Excellent 8.5% |
| Albanians | 83.3 /100 | #144 | Excellent 8.5% |
| Immigrants | South Eastern Asia | 83.2 /100 | #145 | Excellent 8.5% |
Demographics Similar to Guamanians/Chamorros by Family Poverty
In terms of family poverty, the demographic groups most similar to Guamanians/Chamorros are Celtic (8.8%, a difference of 0.030%), Afghan (8.8%, a difference of 0.18%), Pennsylvania German (8.8%, a difference of 0.19%), Ethiopian (8.8%, a difference of 0.24%), and Immigrants from Ethiopia (8.9%, a difference of 0.32%).
| Demographics | Rating | Rank | Family Poverty |
| Whites/Caucasians | 69.1 /100 | #158 | Good 8.8% |
| Peruvians | 68.0 /100 | #159 | Good 8.8% |
| Hungarians | 67.2 /100 | #160 | Good 8.8% |
| Immigrants | Northern Africa | 66.9 /100 | #161 | Good 8.8% |
| Ethiopians | 66.3 /100 | #162 | Good 8.8% |
| Pennsylvania Germans | 66.0 /100 | #163 | Good 8.8% |
| Celtics | 64.9 /100 | #164 | Good 8.8% |
| Guamanians/Chamorros | 64.7 /100 | #165 | Good 8.8% |
| Afghans | 63.5 /100 | #166 | Good 8.8% |
| Immigrants | Ethiopia | 62.5 /100 | #167 | Good 8.9% |
| Israelis | 62.1 /100 | #168 | Good 8.9% |
| Immigrants | Chile | 59.6 /100 | #169 | Average 8.9% |
| Kenyans | 58.2 /100 | #170 | Average 8.9% |
| Lebanese | 57.6 /100 | #171 | Average 8.9% |
| Immigrants | Peru | 57.5 /100 | #172 | Average 8.9% |