Immigrants from Senegal vs Assyrian/Chaldean/Syriac Bachelor's Degree
COMPARE
Immigrants from Senegal
Assyrian/Chaldean/Syriac
Bachelor's Degree
Bachelor's Degree Comparison
Immigrants from Senegal
Assyrians/Chaldeans/Syriacs
37.6%
BACHELOR'S DEGREE
43.8/ 100
METRIC RATING
181st/ 347
METRIC RANK
39.8%
BACHELOR'S DEGREE
89.4/ 100
METRIC RATING
134th/ 347
METRIC RANK
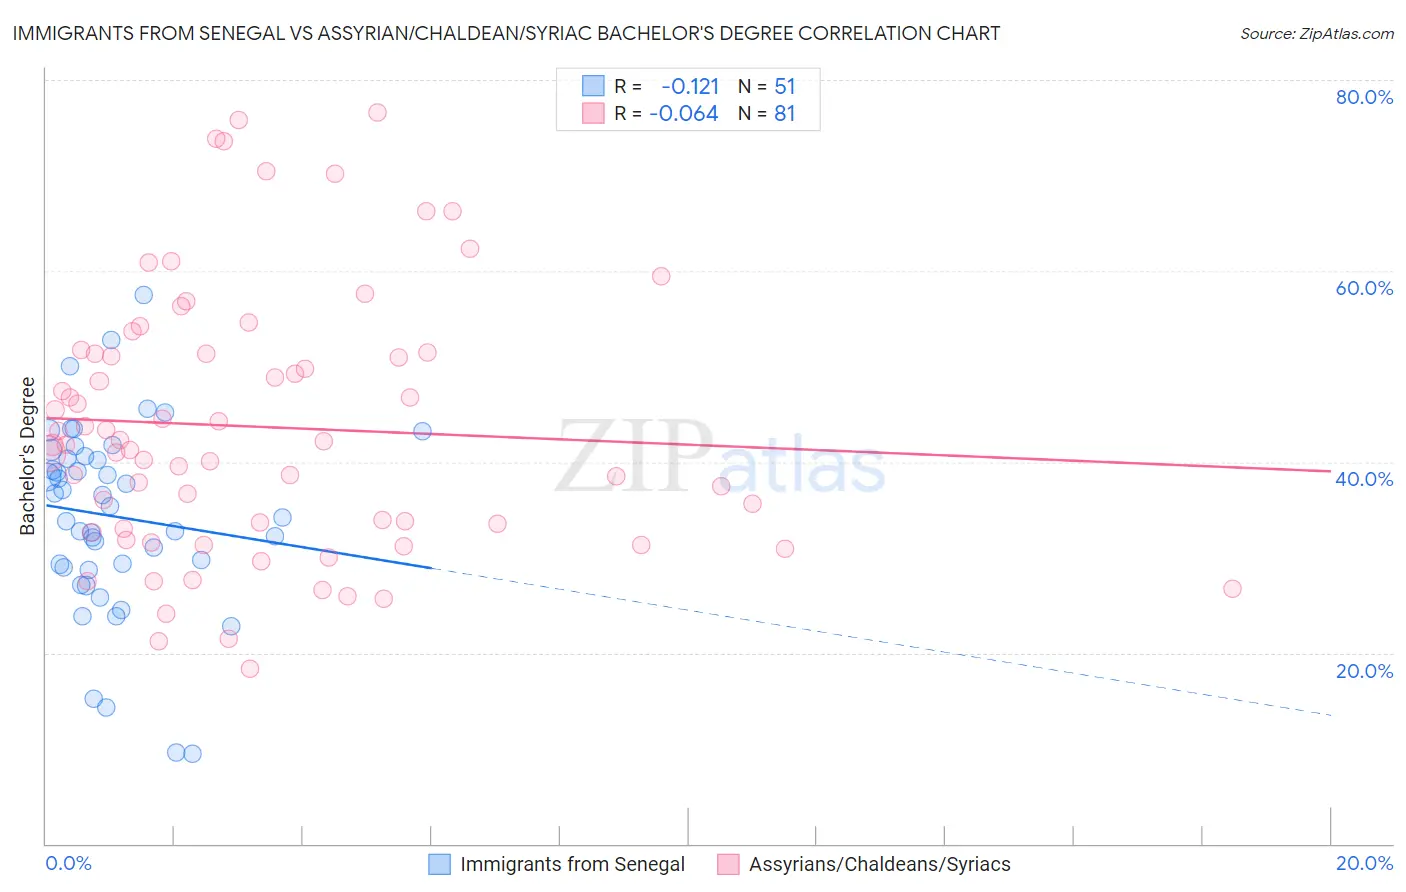
Immigrants from Senegal vs Assyrian/Chaldean/Syriac Bachelor's Degree Correlation Chart
The statistical analysis conducted on geographies consisting of 90,125,204 people shows a poor negative correlation between the proportion of Immigrants from Senegal and percentage of population with at least bachelor's degree education in the United States with a correlation coefficient (R) of -0.121 and weighted average of 37.6%. Similarly, the statistical analysis conducted on geographies consisting of 110,314,164 people shows a slight negative correlation between the proportion of Assyrians/Chaldeans/Syriacs and percentage of population with at least bachelor's degree education in the United States with a correlation coefficient (R) of -0.064 and weighted average of 39.8%, a difference of 5.8%.
Bachelor's Degree Correlation Summary
| Measurement | Immigrants from Senegal | Assyrian/Chaldean/Syriac |
| Minimum | 9.5% | 18.3% |
| Maximum | 57.5% | 76.7% |
| Range | 48.0% | 58.4% |
| Mean | 34.3% | 43.7% |
| Median | 35.4% | 41.8% |
| Interquartile 25% (IQ1) | 29.0% | 32.8% |
| Interquartile 75% (IQ3) | 40.6% | 51.4% |
| Interquartile Range (IQR) | 11.6% | 18.6% |
| Standard Deviation (Sample) | 9.9% | 13.8% |
| Standard Deviation (Population) | 9.8% | 13.7% |
Similar Demographics by Bachelor's Degree
Demographics Similar to Immigrants from Senegal by Bachelor's Degree
In terms of bachelor's degree, the demographic groups most similar to Immigrants from Senegal are Immigrants from Bosnia and Herzegovina (37.6%, a difference of 0.030%), Irish (37.6%, a difference of 0.050%), Immigrants from Colombia (37.7%, a difference of 0.16%), Senegalese (37.5%, a difference of 0.16%), and Scandinavian (37.5%, a difference of 0.20%).
| Demographics | Rating | Rank | Bachelor's Degree |
| Immigrants | Bangladesh | 50.0 /100 | #174 | Average 37.8% |
| Immigrants | Uruguay | 48.3 /100 | #175 | Average 37.8% |
| Costa Ricans | 47.6 /100 | #176 | Average 37.7% |
| Basques | 47.4 /100 | #177 | Average 37.7% |
| Immigrants | Cameroon | 46.8 /100 | #178 | Average 37.7% |
| Immigrants | Colombia | 45.4 /100 | #179 | Average 37.7% |
| Irish | 44.3 /100 | #180 | Average 37.6% |
| Immigrants | Senegal | 43.8 /100 | #181 | Average 37.6% |
| Immigrants | Bosnia and Herzegovina | 43.4 /100 | #182 | Average 37.6% |
| Senegalese | 42.2 /100 | #183 | Average 37.5% |
| Scandinavians | 41.7 /100 | #184 | Average 37.5% |
| Immigrants | Peru | 41.3 /100 | #185 | Average 37.5% |
| Norwegians | 40.4 /100 | #186 | Average 37.5% |
| English | 39.7 /100 | #187 | Fair 37.4% |
| Immigrants | Oceania | 37.3 /100 | #188 | Fair 37.3% |
Demographics Similar to Assyrians/Chaldeans/Syriacs by Bachelor's Degree
In terms of bachelor's degree, the demographic groups most similar to Assyrians/Chaldeans/Syriacs are Luxembourger (39.8%, a difference of 0.080%), Pakistani (39.7%, a difference of 0.28%), Immigrants from Southern Europe (40.0%, a difference of 0.43%), Taiwanese (40.0%, a difference of 0.44%), and Icelander (39.5%, a difference of 0.65%).
| Demographics | Rating | Rank | Bachelor's Degree |
| Immigrants | Jordan | 93.4 /100 | #127 | Exceptional 40.3% |
| Immigrants | Venezuela | 92.9 /100 | #128 | Exceptional 40.2% |
| Serbians | 92.4 /100 | #129 | Exceptional 40.1% |
| Sierra Leoneans | 92.2 /100 | #130 | Exceptional 40.1% |
| Italians | 91.9 /100 | #131 | Exceptional 40.1% |
| Taiwanese | 91.1 /100 | #132 | Exceptional 40.0% |
| Immigrants | Southern Europe | 91.1 /100 | #133 | Exceptional 40.0% |
| Assyrians/Chaldeans/Syriacs | 89.4 /100 | #134 | Excellent 39.8% |
| Luxembourgers | 89.1 /100 | #135 | Excellent 39.8% |
| Pakistanis | 88.2 /100 | #136 | Excellent 39.7% |
| Icelanders | 86.5 /100 | #137 | Excellent 39.5% |
| Europeans | 85.6 /100 | #138 | Excellent 39.5% |
| Immigrants | Sudan | 84.5 /100 | #139 | Excellent 39.4% |
| Immigrants | Armenia | 84.1 /100 | #140 | Excellent 39.4% |
| South American Indians | 83.6 /100 | #141 | Excellent 39.3% |