Immigrants from Scotland vs White/Caucasian Poverty
COMPARE
Immigrants from Scotland
White/Caucasian
Poverty
Poverty Comparison
Immigrants from Scotland
Whites/Caucasians
10.6%
POVERTY
99.7/ 100
METRIC RATING
19th/ 347
METRIC RANK
12.3%
POVERTY
55.4/ 100
METRIC RATING
169th/ 347
METRIC RANK
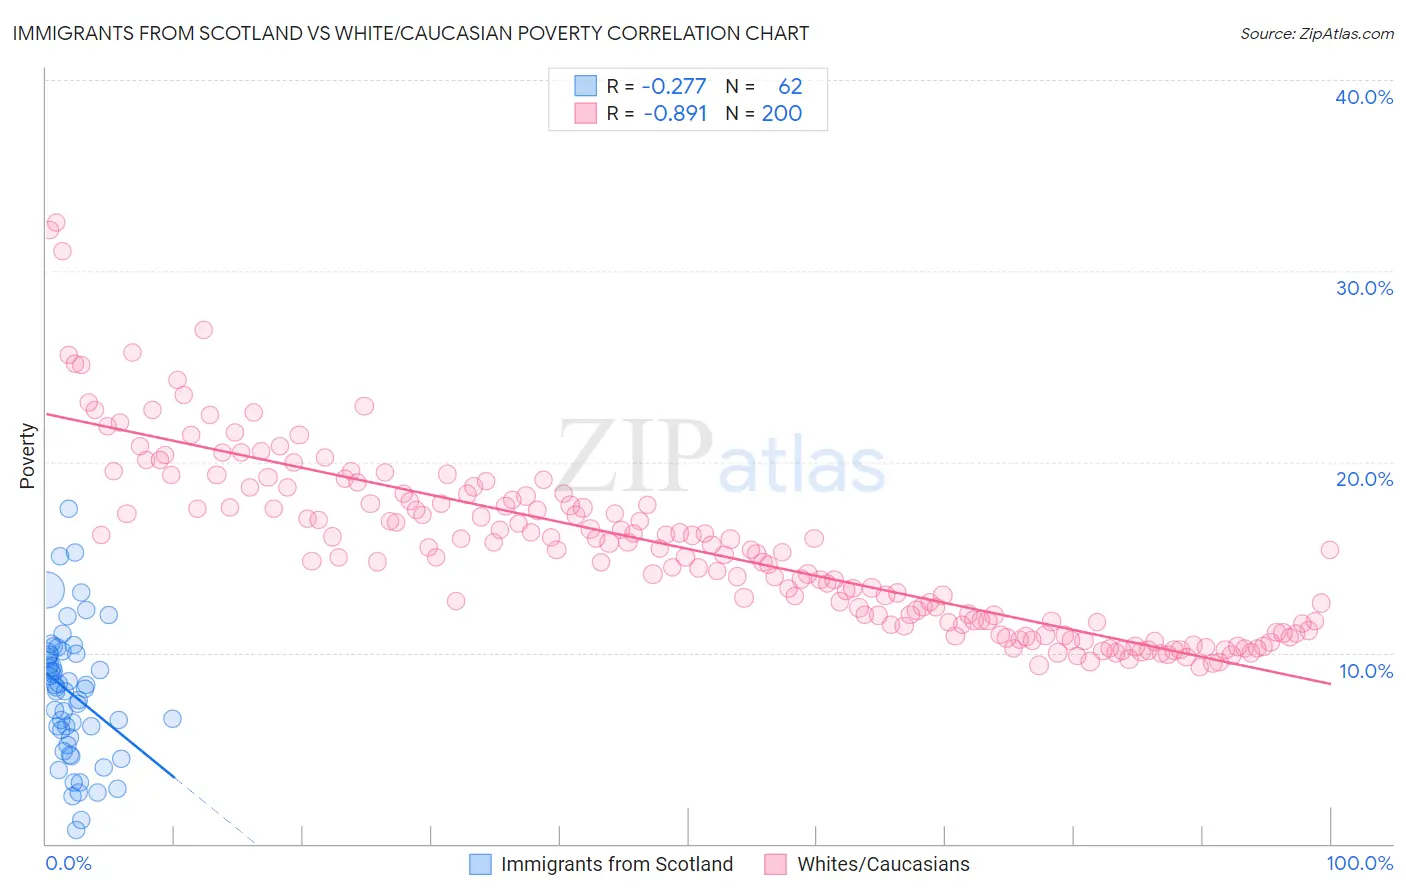
Immigrants from Scotland vs White/Caucasian Poverty Correlation Chart
The statistical analysis conducted on geographies consisting of 196,384,756 people shows a weak negative correlation between the proportion of Immigrants from Scotland and poverty level in the United States with a correlation coefficient (R) of -0.277 and weighted average of 10.6%. Similarly, the statistical analysis conducted on geographies consisting of 583,792,023 people shows a very strong negative correlation between the proportion of Whites/Caucasians and poverty level in the United States with a correlation coefficient (R) of -0.891 and weighted average of 12.3%, a difference of 16.0%.
Poverty Correlation Summary
| Measurement | Immigrants from Scotland | White/Caucasian |
| Minimum | 0.74% | 9.2% |
| Maximum | 17.6% | 32.6% |
| Range | 16.8% | 23.3% |
| Mean | 7.8% | 15.4% |
| Median | 8.2% | 15.2% |
| Interquartile 25% (IQ1) | 5.6% | 11.5% |
| Interquartile 75% (IQ3) | 9.9% | 18.0% |
| Interquartile Range (IQR) | 4.4% | 6.5% |
| Standard Deviation (Sample) | 3.5% | 4.6% |
| Standard Deviation (Population) | 3.4% | 4.6% |
Similar Demographics by Poverty
Demographics Similar to Immigrants from Scotland by Poverty
In terms of poverty, the demographic groups most similar to Immigrants from Scotland are Immigrants from North Macedonia (10.6%, a difference of 0.11%), Luxembourger (10.6%, a difference of 0.19%), Eastern European (10.6%, a difference of 0.35%), Latvian (10.5%, a difference of 0.39%), and Swedish (10.6%, a difference of 0.46%).
| Demographics | Rating | Rank | Poverty |
| Bhutanese | 99.8 /100 | #12 | Exceptional 10.4% |
| Immigrants | Hong Kong | 99.8 /100 | #13 | Exceptional 10.4% |
| Immigrants | Bolivia | 99.8 /100 | #14 | Exceptional 10.4% |
| Bolivians | 99.8 /100 | #15 | Exceptional 10.4% |
| Lithuanians | 99.8 /100 | #16 | Exceptional 10.5% |
| Norwegians | 99.8 /100 | #17 | Exceptional 10.5% |
| Latvians | 99.8 /100 | #18 | Exceptional 10.5% |
| Immigrants | Scotland | 99.7 /100 | #19 | Exceptional 10.6% |
| Immigrants | North Macedonia | 99.7 /100 | #20 | Exceptional 10.6% |
| Luxembourgers | 99.7 /100 | #21 | Exceptional 10.6% |
| Eastern Europeans | 99.7 /100 | #22 | Exceptional 10.6% |
| Swedes | 99.7 /100 | #23 | Exceptional 10.6% |
| Italians | 99.7 /100 | #24 | Exceptional 10.6% |
| Croatians | 99.6 /100 | #25 | Exceptional 10.6% |
| Burmese | 99.6 /100 | #26 | Exceptional 10.7% |
Demographics Similar to Whites/Caucasians by Poverty
In terms of poverty, the demographic groups most similar to Whites/Caucasians are Immigrants from Oceania (12.3%, a difference of 0.080%), Immigrants from Venezuela (12.2%, a difference of 0.11%), Immigrants from Chile (12.2%, a difference of 0.13%), Venezuelan (12.2%, a difference of 0.15%), and Immigrants from Albania (12.2%, a difference of 0.23%).
| Demographics | Rating | Rank | Poverty |
| Ethiopians | 59.1 /100 | #162 | Average 12.2% |
| Immigrants | Ethiopia | 58.6 /100 | #163 | Average 12.2% |
| Colombians | 57.8 /100 | #164 | Average 12.2% |
| Immigrants | Albania | 57.7 /100 | #165 | Average 12.2% |
| Venezuelans | 56.9 /100 | #166 | Average 12.2% |
| Immigrants | Chile | 56.7 /100 | #167 | Average 12.2% |
| Immigrants | Venezuela | 56.5 /100 | #168 | Average 12.2% |
| Whites/Caucasians | 55.4 /100 | #169 | Average 12.3% |
| Immigrants | Oceania | 54.6 /100 | #170 | Average 12.3% |
| Immigrants | Spain | 51.3 /100 | #171 | Average 12.3% |
| Immigrants | Portugal | 50.5 /100 | #172 | Average 12.3% |
| Celtics | 50.1 /100 | #173 | Average 12.3% |
| Lebanese | 50.0 /100 | #174 | Average 12.3% |
| South Americans | 48.7 /100 | #175 | Average 12.3% |
| Immigrants | Colombia | 47.7 /100 | #176 | Average 12.3% |