Immigrants from Scotland vs Austrian Poverty
COMPARE
Immigrants from Scotland
Austrian
Poverty
Poverty Comparison
Immigrants from Scotland
Austrians
10.6%
POVERTY
99.7/ 100
METRIC RATING
19th/ 347
METRIC RANK
11.2%
POVERTY
97.8/ 100
METRIC RATING
62nd/ 347
METRIC RANK
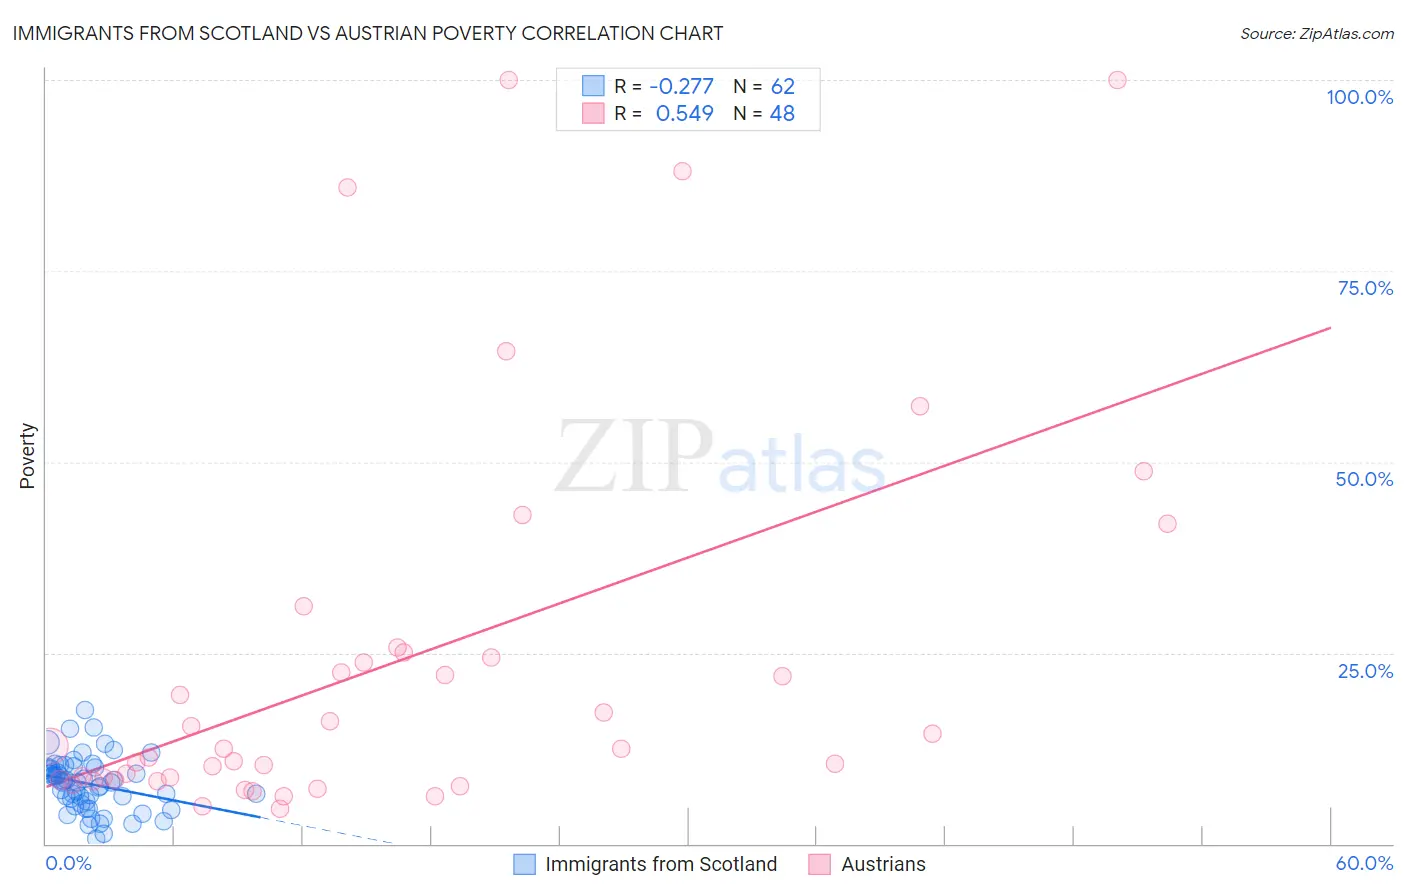
Immigrants from Scotland vs Austrian Poverty Correlation Chart
The statistical analysis conducted on geographies consisting of 196,384,756 people shows a weak negative correlation between the proportion of Immigrants from Scotland and poverty level in the United States with a correlation coefficient (R) of -0.277 and weighted average of 10.6%. Similarly, the statistical analysis conducted on geographies consisting of 451,775,249 people shows a substantial positive correlation between the proportion of Austrians and poverty level in the United States with a correlation coefficient (R) of 0.549 and weighted average of 11.2%, a difference of 5.9%.
Poverty Correlation Summary
| Measurement | Immigrants from Scotland | Austrian |
| Minimum | 0.74% | 4.6% |
| Maximum | 17.6% | 100.0% |
| Range | 16.8% | 95.4% |
| Mean | 7.8% | 23.7% |
| Median | 8.2% | 12.5% |
| Interquartile 25% (IQ1) | 5.6% | 8.4% |
| Interquartile 75% (IQ3) | 9.9% | 24.7% |
| Interquartile Range (IQR) | 4.4% | 16.3% |
| Standard Deviation (Sample) | 3.5% | 25.3% |
| Standard Deviation (Population) | 3.4% | 25.0% |
Similar Demographics by Poverty
Demographics Similar to Immigrants from Scotland by Poverty
In terms of poverty, the demographic groups most similar to Immigrants from Scotland are Immigrants from North Macedonia (10.6%, a difference of 0.11%), Luxembourger (10.6%, a difference of 0.19%), Eastern European (10.6%, a difference of 0.35%), Latvian (10.5%, a difference of 0.39%), and Swedish (10.6%, a difference of 0.46%).
| Demographics | Rating | Rank | Poverty |
| Bhutanese | 99.8 /100 | #12 | Exceptional 10.4% |
| Immigrants | Hong Kong | 99.8 /100 | #13 | Exceptional 10.4% |
| Immigrants | Bolivia | 99.8 /100 | #14 | Exceptional 10.4% |
| Bolivians | 99.8 /100 | #15 | Exceptional 10.4% |
| Lithuanians | 99.8 /100 | #16 | Exceptional 10.5% |
| Norwegians | 99.8 /100 | #17 | Exceptional 10.5% |
| Latvians | 99.8 /100 | #18 | Exceptional 10.5% |
| Immigrants | Scotland | 99.7 /100 | #19 | Exceptional 10.6% |
| Immigrants | North Macedonia | 99.7 /100 | #20 | Exceptional 10.6% |
| Luxembourgers | 99.7 /100 | #21 | Exceptional 10.6% |
| Eastern Europeans | 99.7 /100 | #22 | Exceptional 10.6% |
| Swedes | 99.7 /100 | #23 | Exceptional 10.6% |
| Italians | 99.7 /100 | #24 | Exceptional 10.6% |
| Croatians | 99.6 /100 | #25 | Exceptional 10.6% |
| Burmese | 99.6 /100 | #26 | Exceptional 10.7% |
Demographics Similar to Austrians by Poverty
In terms of poverty, the demographic groups most similar to Austrians are Ukrainian (11.2%, a difference of 0.0%), Immigrants from Italy (11.2%, a difference of 0.030%), Immigrants from Sri Lanka (11.2%, a difference of 0.10%), Swiss (11.2%, a difference of 0.22%), and Immigrants from Europe (11.2%, a difference of 0.26%).
| Demographics | Rating | Rank | Poverty |
| Immigrants | Serbia | 98.5 /100 | #55 | Exceptional 11.1% |
| Estonians | 98.2 /100 | #56 | Exceptional 11.1% |
| Scandinavians | 98.2 /100 | #57 | Exceptional 11.1% |
| Germans | 98.1 /100 | #58 | Exceptional 11.1% |
| Immigrants | Europe | 98.0 /100 | #59 | Exceptional 11.2% |
| Immigrants | Sri Lanka | 97.9 /100 | #60 | Exceptional 11.2% |
| Immigrants | Italy | 97.9 /100 | #61 | Exceptional 11.2% |
| Austrians | 97.8 /100 | #62 | Exceptional 11.2% |
| Ukrainians | 97.8 /100 | #63 | Exceptional 11.2% |
| Swiss | 97.7 /100 | #64 | Exceptional 11.2% |
| Immigrants | Asia | 97.5 /100 | #65 | Exceptional 11.2% |
| Immigrants | Netherlands | 97.5 /100 | #66 | Exceptional 11.2% |
| Immigrants | Australia | 97.4 /100 | #67 | Exceptional 11.2% |
| Slovaks | 97.4 /100 | #68 | Exceptional 11.2% |
| Serbians | 97.4 /100 | #69 | Exceptional 11.2% |