Immigrants from Eritrea vs Barbadian Male Poverty
COMPARE
Immigrants from Eritrea
Barbadian
Male Poverty
Male Poverty Comparison
Immigrants from Eritrea
Barbadians
12.2%
MALE POVERTY
2.4/ 100
METRIC RATING
220th/ 347
METRIC RANK
13.6%
MALE POVERTY
0.0/ 100
METRIC RATING
275th/ 347
METRIC RANK
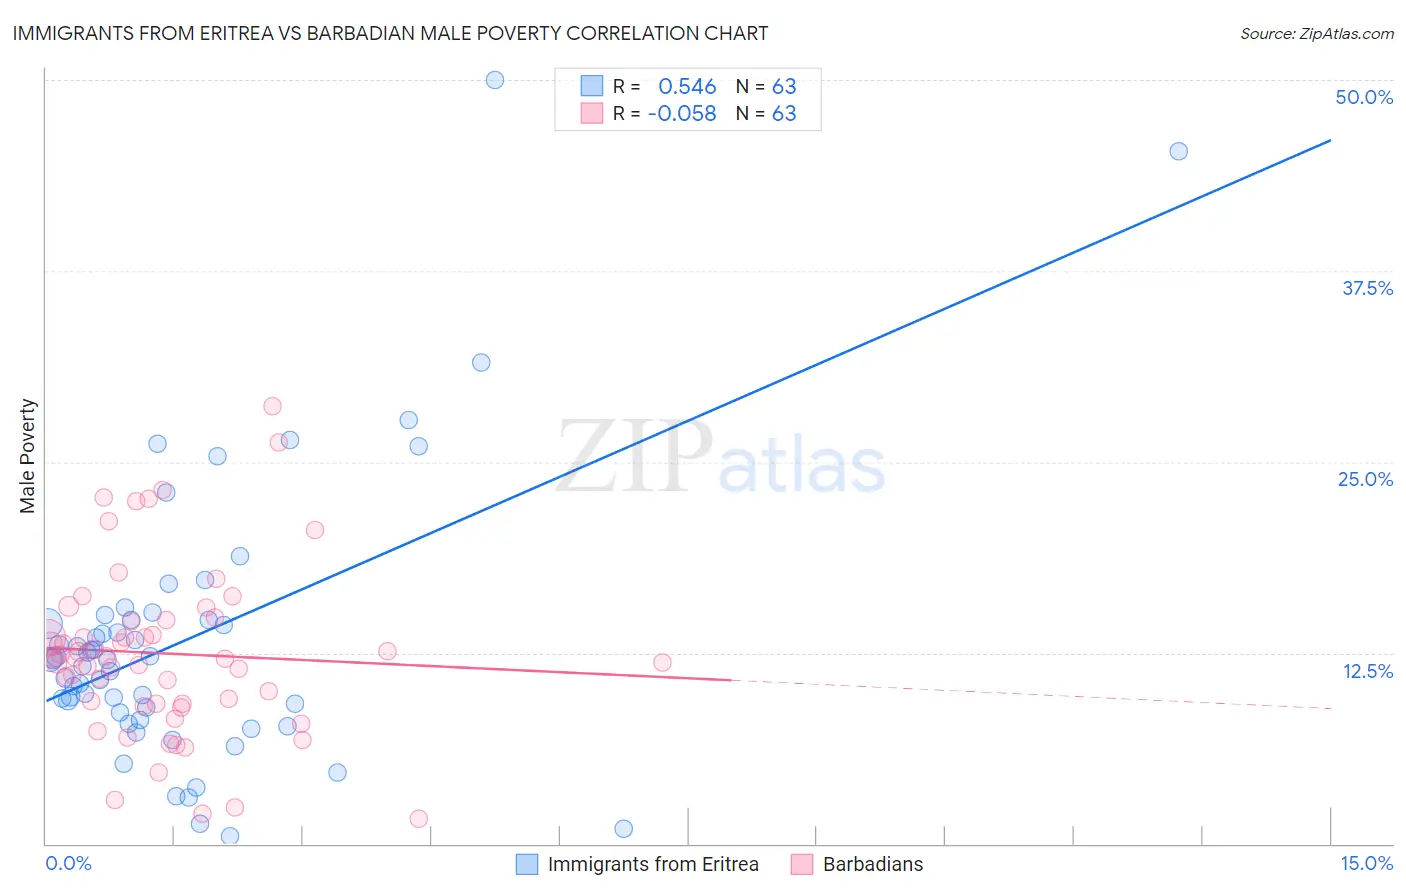
Immigrants from Eritrea vs Barbadian Male Poverty Correlation Chart
The statistical analysis conducted on geographies consisting of 104,841,336 people shows a substantial positive correlation between the proportion of Immigrants from Eritrea and poverty level among males in the United States with a correlation coefficient (R) of 0.546 and weighted average of 12.2%. Similarly, the statistical analysis conducted on geographies consisting of 141,266,401 people shows a slight negative correlation between the proportion of Barbadians and poverty level among males in the United States with a correlation coefficient (R) of -0.058 and weighted average of 13.6%, a difference of 11.3%.
Male Poverty Correlation Summary
| Measurement | Immigrants from Eritrea | Barbadian |
| Minimum | 0.53% | 1.6% |
| Maximum | 50.0% | 28.7% |
| Range | 49.5% | 27.1% |
| Mean | 13.4% | 12.5% |
| Median | 12.0% | 12.2% |
| Interquartile 25% (IQ1) | 8.6% | 9.2% |
| Interquartile 75% (IQ3) | 14.7% | 14.7% |
| Interquartile Range (IQR) | 6.1% | 5.5% |
| Standard Deviation (Sample) | 9.0% | 5.6% |
| Standard Deviation (Population) | 9.0% | 5.5% |
Similar Demographics by Male Poverty
Demographics Similar to Immigrants from Eritrea by Male Poverty
In terms of male poverty, the demographic groups most similar to Immigrants from Eritrea are Bermudan (12.2%, a difference of 0.020%), German Russian (12.2%, a difference of 0.080%), Immigrants from Thailand (12.2%, a difference of 0.11%), Immigrants from Cambodia (12.2%, a difference of 0.12%), and Immigrants from Uzbekistan (12.2%, a difference of 0.20%).
| Demographics | Rating | Rank | Male Poverty |
| Immigrants | Nonimmigrants | 3.1 /100 | #213 | Tragic 12.1% |
| Japanese | 2.7 /100 | #214 | Tragic 12.2% |
| Immigrants | Uzbekistan | 2.6 /100 | #215 | Tragic 12.2% |
| Immigrants | Cambodia | 2.5 /100 | #216 | Tragic 12.2% |
| Immigrants | Thailand | 2.5 /100 | #217 | Tragic 12.2% |
| German Russians | 2.5 /100 | #218 | Tragic 12.2% |
| Bermudans | 2.4 /100 | #219 | Tragic 12.2% |
| Immigrants | Eritrea | 2.4 /100 | #220 | Tragic 12.2% |
| Ugandans | 2.2 /100 | #221 | Tragic 12.2% |
| Immigrants | Africa | 2.1 /100 | #222 | Tragic 12.2% |
| Immigrants | Micronesia | 2.1 /100 | #223 | Tragic 12.2% |
| Immigrants | Nigeria | 1.6 /100 | #224 | Tragic 12.3% |
| Osage | 1.5 /100 | #225 | Tragic 12.3% |
| Nigerians | 1.4 /100 | #226 | Tragic 12.3% |
| Alaska Natives | 1.4 /100 | #227 | Tragic 12.4% |
Demographics Similar to Barbadians by Male Poverty
In terms of male poverty, the demographic groups most similar to Barbadians are Immigrants from Latin America (13.6%, a difference of 0.19%), Bangladeshi (13.6%, a difference of 0.34%), Belizean (13.6%, a difference of 0.44%), Haitian (13.7%, a difference of 0.61%), and Immigrants from West Indies (13.5%, a difference of 0.62%).
| Demographics | Rating | Rank | Male Poverty |
| Sub-Saharan Africans | 0.1 /100 | #268 | Tragic 13.3% |
| Guyanese | 0.0 /100 | #269 | Tragic 13.3% |
| Cree | 0.0 /100 | #270 | Tragic 13.3% |
| Spanish Americans | 0.0 /100 | #271 | Tragic 13.4% |
| Immigrants | Bahamas | 0.0 /100 | #272 | Tragic 13.5% |
| Chickasaw | 0.0 /100 | #273 | Tragic 13.5% |
| Immigrants | West Indies | 0.0 /100 | #274 | Tragic 13.5% |
| Barbadians | 0.0 /100 | #275 | Tragic 13.6% |
| Immigrants | Latin America | 0.0 /100 | #276 | Tragic 13.6% |
| Bangladeshis | 0.0 /100 | #277 | Tragic 13.6% |
| Belizeans | 0.0 /100 | #278 | Tragic 13.6% |
| Haitians | 0.0 /100 | #279 | Tragic 13.7% |
| Mexicans | 0.0 /100 | #280 | Tragic 13.7% |
| Yaqui | 0.0 /100 | #281 | Tragic 13.7% |
| Immigrants | Cabo Verde | 0.0 /100 | #282 | Tragic 13.7% |