Immigrants from Scotland vs Barbadian Child Poverty Under the Age of 16
COMPARE
Immigrants from Scotland
Barbadian
Child Poverty Under the Age of 16
Child Poverty Under the Age of 16 Comparison
Immigrants from Scotland
Barbadians
13.7%
CHILD POVERTY UNDER THE AGE OF 16
99.4/ 100
METRIC RATING
40th/ 347
METRIC RANK
20.0%
CHILD POVERTY UNDER THE AGE OF 16
0.0/ 100
METRIC RATING
282nd/ 347
METRIC RANK
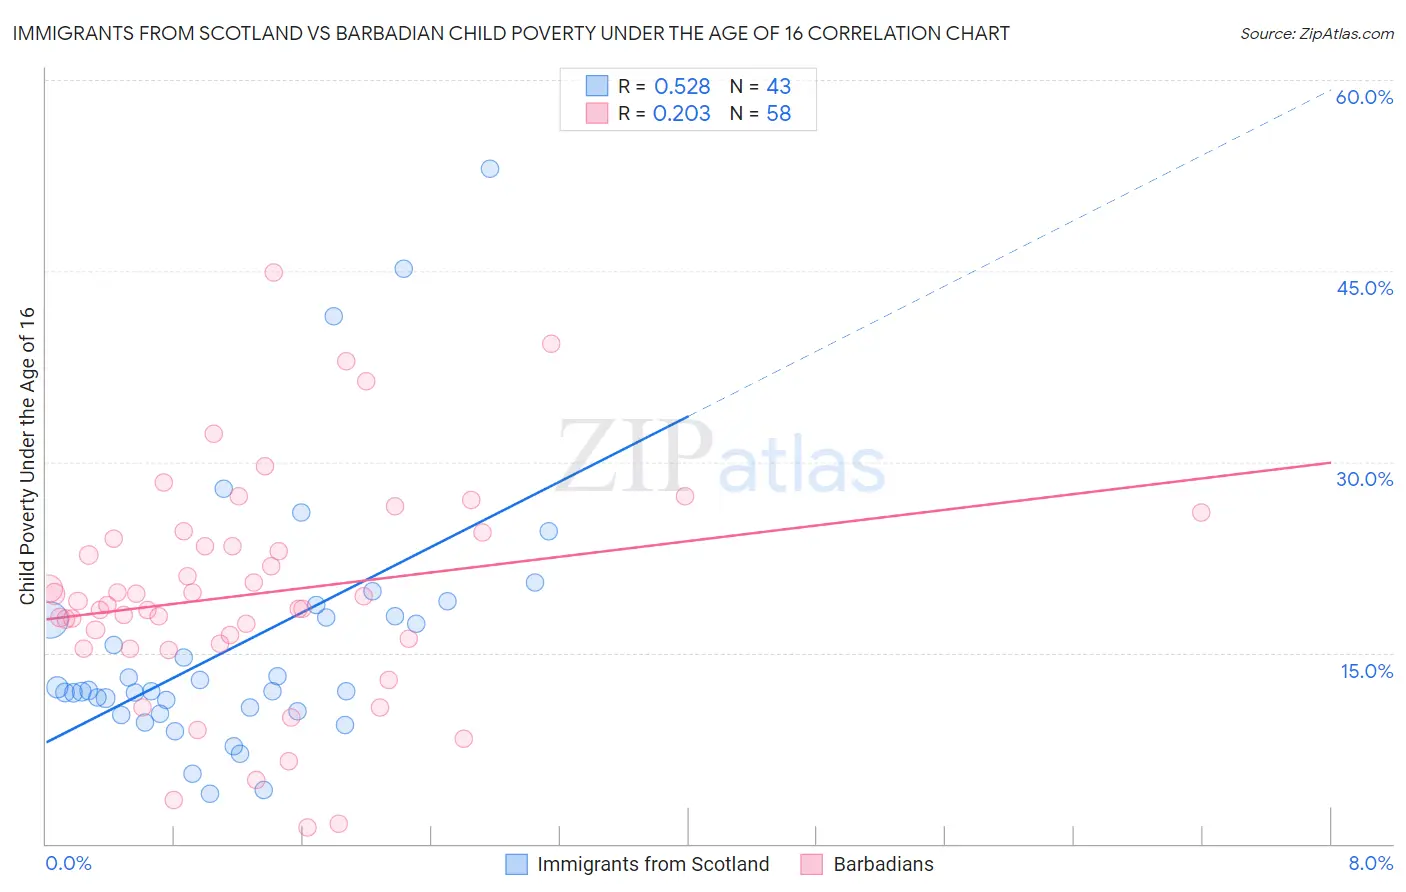
Immigrants from Scotland vs Barbadian Child Poverty Under the Age of 16 Correlation Chart
The statistical analysis conducted on geographies consisting of 195,173,280 people shows a substantial positive correlation between the proportion of Immigrants from Scotland and poverty level among children under the age of 16 in the United States with a correlation coefficient (R) of 0.528 and weighted average of 13.7%. Similarly, the statistical analysis conducted on geographies consisting of 140,893,894 people shows a weak positive correlation between the proportion of Barbadians and poverty level among children under the age of 16 in the United States with a correlation coefficient (R) of 0.203 and weighted average of 20.0%, a difference of 46.0%.
Child Poverty Under the Age of 16 Correlation Summary
| Measurement | Immigrants from Scotland | Barbadian |
| Minimum | 3.9% | 1.2% |
| Maximum | 53.0% | 44.9% |
| Range | 49.1% | 43.6% |
| Mean | 15.7% | 19.6% |
| Median | 12.0% | 18.9% |
| Interquartile 25% (IQ1) | 10.4% | 15.7% |
| Interquartile 75% (IQ3) | 17.9% | 24.0% |
| Interquartile Range (IQR) | 7.5% | 8.3% |
| Standard Deviation (Sample) | 10.1% | 8.7% |
| Standard Deviation (Population) | 10.0% | 8.7% |
Similar Demographics by Child Poverty Under the Age of 16
Demographics Similar to Immigrants from Scotland by Child Poverty Under the Age of 16
In terms of child poverty under the age of 16, the demographic groups most similar to Immigrants from Scotland are Croatian (13.8%, a difference of 0.16%), Immigrants from Sri Lanka (13.8%, a difference of 0.24%), Immigrants from Moldova (13.8%, a difference of 0.30%), Greek (13.8%, a difference of 0.47%), and Czech (13.8%, a difference of 0.53%).
| Demographics | Rating | Rank | Child Poverty Under the Age of 16 |
| Asians | 99.6 /100 | #33 | Exceptional 13.5% |
| Russians | 99.6 /100 | #34 | Exceptional 13.5% |
| Lithuanians | 99.6 /100 | #35 | Exceptional 13.5% |
| Immigrants | Northern Europe | 99.6 /100 | #36 | Exceptional 13.6% |
| Immigrants | Bolivia | 99.6 /100 | #37 | Exceptional 13.6% |
| Luxembourgers | 99.5 /100 | #38 | Exceptional 13.6% |
| Immigrants | Australia | 99.5 /100 | #39 | Exceptional 13.6% |
| Immigrants | Scotland | 99.4 /100 | #40 | Exceptional 13.7% |
| Croatians | 99.4 /100 | #41 | Exceptional 13.8% |
| Immigrants | Sri Lanka | 99.3 /100 | #42 | Exceptional 13.8% |
| Immigrants | Moldova | 99.3 /100 | #43 | Exceptional 13.8% |
| Greeks | 99.3 /100 | #44 | Exceptional 13.8% |
| Czechs | 99.3 /100 | #45 | Exceptional 13.8% |
| Immigrants | Asia | 99.2 /100 | #46 | Exceptional 13.8% |
| Estonians | 99.2 /100 | #47 | Exceptional 13.9% |
Demographics Similar to Barbadians by Child Poverty Under the Age of 16
In terms of child poverty under the age of 16, the demographic groups most similar to Barbadians are Central American (20.0%, a difference of 0.030%), Immigrants from Zaire (20.1%, a difference of 0.23%), West Indian (20.1%, a difference of 0.37%), Immigrants from St. Vincent and the Grenadines (20.1%, a difference of 0.43%), and Immigrants from West Indies (20.2%, a difference of 0.57%).
| Demographics | Rating | Rank | Child Poverty Under the Age of 16 |
| Immigrants | Barbados | 0.1 /100 | #275 | Tragic 19.9% |
| Belizeans | 0.1 /100 | #276 | Tragic 19.9% |
| Iroquois | 0.1 /100 | #277 | Tragic 19.9% |
| Bangladeshis | 0.0 /100 | #278 | Tragic 19.9% |
| Sub-Saharan Africans | 0.0 /100 | #279 | Tragic 19.9% |
| Comanche | 0.0 /100 | #280 | Tragic 19.9% |
| Central Americans | 0.0 /100 | #281 | Tragic 20.0% |
| Barbadians | 0.0 /100 | #282 | Tragic 20.0% |
| Immigrants | Zaire | 0.0 /100 | #283 | Tragic 20.1% |
| West Indians | 0.0 /100 | #284 | Tragic 20.1% |
| Immigrants | St. Vincent and the Grenadines | 0.0 /100 | #285 | Tragic 20.1% |
| Immigrants | West Indies | 0.0 /100 | #286 | Tragic 20.2% |
| Blackfeet | 0.0 /100 | #287 | Tragic 20.2% |
| Immigrants | Belize | 0.0 /100 | #288 | Tragic 20.3% |
| Senegalese | 0.0 /100 | #289 | Tragic 20.4% |