Argentinean vs Immigrants from Norway Family Poverty
COMPARE
Argentinean
Immigrants from Norway
Family Poverty
Family Poverty Comparison
Argentineans
Immigrants from Norway
8.4%
FAMILY POVERTY
89.6/ 100
METRIC RATING
128th/ 347
METRIC RANK
8.1%
FAMILY POVERTY
95.7/ 100
METRIC RATING
101st/ 347
METRIC RANK
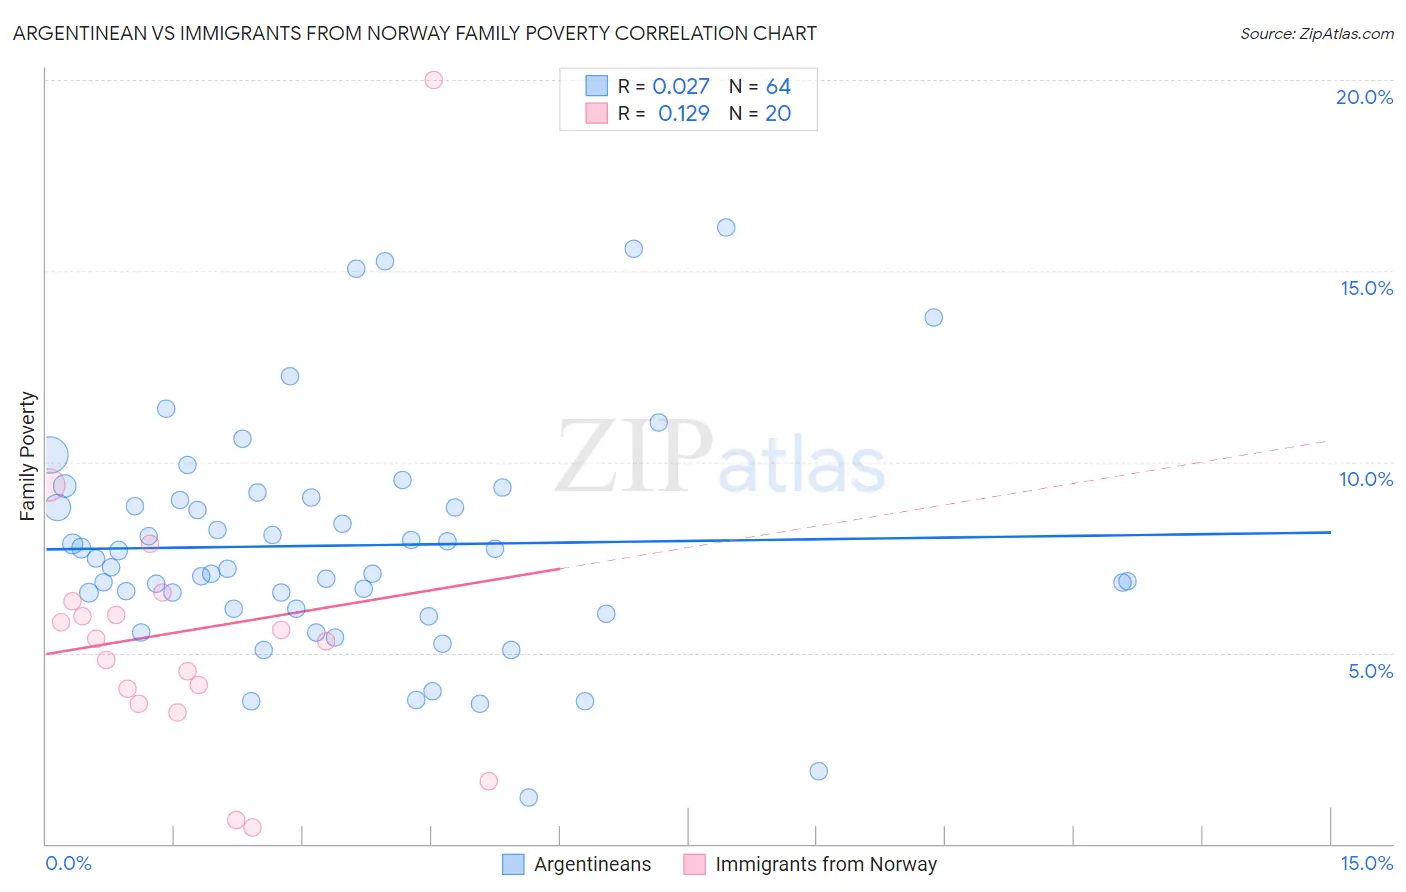
Argentinean vs Immigrants from Norway Family Poverty Correlation Chart
The statistical analysis conducted on geographies consisting of 296,579,714 people shows no correlation between the proportion of Argentineans and poverty level among families in the United States with a correlation coefficient (R) of 0.027 and weighted average of 8.4%. Similarly, the statistical analysis conducted on geographies consisting of 116,627,868 people shows a poor positive correlation between the proportion of Immigrants from Norway and poverty level among families in the United States with a correlation coefficient (R) of 0.129 and weighted average of 8.1%, a difference of 3.5%.
Family Poverty Correlation Summary
| Measurement | Argentinean | Immigrants from Norway |
| Minimum | 1.2% | 0.43% |
| Maximum | 16.2% | 20.0% |
| Range | 14.9% | 19.6% |
| Mean | 7.8% | 5.6% |
| Median | 7.4% | 5.3% |
| Interquartile 25% (IQ1) | 6.2% | 3.9% |
| Interquartile 75% (IQ3) | 9.0% | 6.2% |
| Interquartile Range (IQR) | 2.9% | 2.3% |
| Standard Deviation (Sample) | 3.0% | 4.0% |
| Standard Deviation (Population) | 3.0% | 3.9% |
Similar Demographics by Family Poverty
Demographics Similar to Argentineans by Family Poverty
In terms of family poverty, the demographic groups most similar to Argentineans are Immigrants from Hungary (8.4%, a difference of 0.14%), Portuguese (8.4%, a difference of 0.15%), Icelander (8.3%, a difference of 0.27%), Immigrants from Bosnia and Herzegovina (8.4%, a difference of 0.34%), and Puget Sound Salish (8.4%, a difference of 0.35%).
| Demographics | Rating | Rank | Family Poverty |
| Native Hawaiians | 91.3 /100 | #121 | Exceptional 8.3% |
| Paraguayans | 91.2 /100 | #122 | Exceptional 8.3% |
| Palestinians | 91.1 /100 | #123 | Exceptional 8.3% |
| Soviet Union | 90.8 /100 | #124 | Exceptional 8.3% |
| Pakistanis | 90.8 /100 | #125 | Exceptional 8.3% |
| Icelanders | 90.3 /100 | #126 | Exceptional 8.3% |
| Immigrants | Hungary | 89.9 /100 | #127 | Excellent 8.4% |
| Argentineans | 89.6 /100 | #128 | Excellent 8.4% |
| Portuguese | 89.2 /100 | #129 | Excellent 8.4% |
| Immigrants | Bosnia and Herzegovina | 88.6 /100 | #130 | Excellent 8.4% |
| Puget Sound Salish | 88.6 /100 | #131 | Excellent 8.4% |
| Immigrants | Argentina | 88.2 /100 | #132 | Excellent 8.4% |
| Sri Lankans | 86.6 /100 | #133 | Excellent 8.5% |
| Chileans | 86.6 /100 | #134 | Excellent 8.5% |
| Immigrants | Malaysia | 86.5 /100 | #135 | Excellent 8.5% |
Demographics Similar to Immigrants from Norway by Family Poverty
In terms of family poverty, the demographic groups most similar to Immigrants from Norway are Immigrants from Indonesia (8.1%, a difference of 0.010%), New Zealander (8.1%, a difference of 0.030%), Welsh (8.1%, a difference of 0.10%), Immigrants from Eastern Europe (8.1%, a difference of 0.10%), and Slavic (8.1%, a difference of 0.11%).
| Demographics | Rating | Rank | Family Poverty |
| Immigrants | Pakistan | 96.6 /100 | #94 | Exceptional 8.0% |
| Immigrants | Philippines | 96.5 /100 | #95 | Exceptional 8.0% |
| Immigrants | Turkey | 96.5 /100 | #96 | Exceptional 8.0% |
| Immigrants | Switzerland | 96.1 /100 | #97 | Exceptional 8.1% |
| Immigrants | South Africa | 95.9 /100 | #98 | Exceptional 8.1% |
| Welsh | 95.8 /100 | #99 | Exceptional 8.1% |
| New Zealanders | 95.8 /100 | #100 | Exceptional 8.1% |
| Immigrants | Norway | 95.7 /100 | #101 | Exceptional 8.1% |
| Immigrants | Indonesia | 95.7 /100 | #102 | Exceptional 8.1% |
| Immigrants | Eastern Europe | 95.6 /100 | #103 | Exceptional 8.1% |
| Slavs | 95.6 /100 | #104 | Exceptional 8.1% |
| Laotians | 95.6 /100 | #105 | Exceptional 8.1% |
| Egyptians | 95.1 /100 | #106 | Exceptional 8.1% |
| French Canadians | 95.0 /100 | #107 | Exceptional 8.1% |
| Basques | 94.9 /100 | #108 | Exceptional 8.1% |