Immigrants from Poland vs Salvadoran Family Poverty
COMPARE
Immigrants from Poland
Salvadoran
Family Poverty
Family Poverty Comparison
Immigrants from Poland
Salvadorans
7.9%
FAMILY POVERTY
97.8/ 100
METRIC RATING
82nd/ 347
METRIC RANK
10.7%
FAMILY POVERTY
0.3/ 100
METRIC RATING
250th/ 347
METRIC RANK
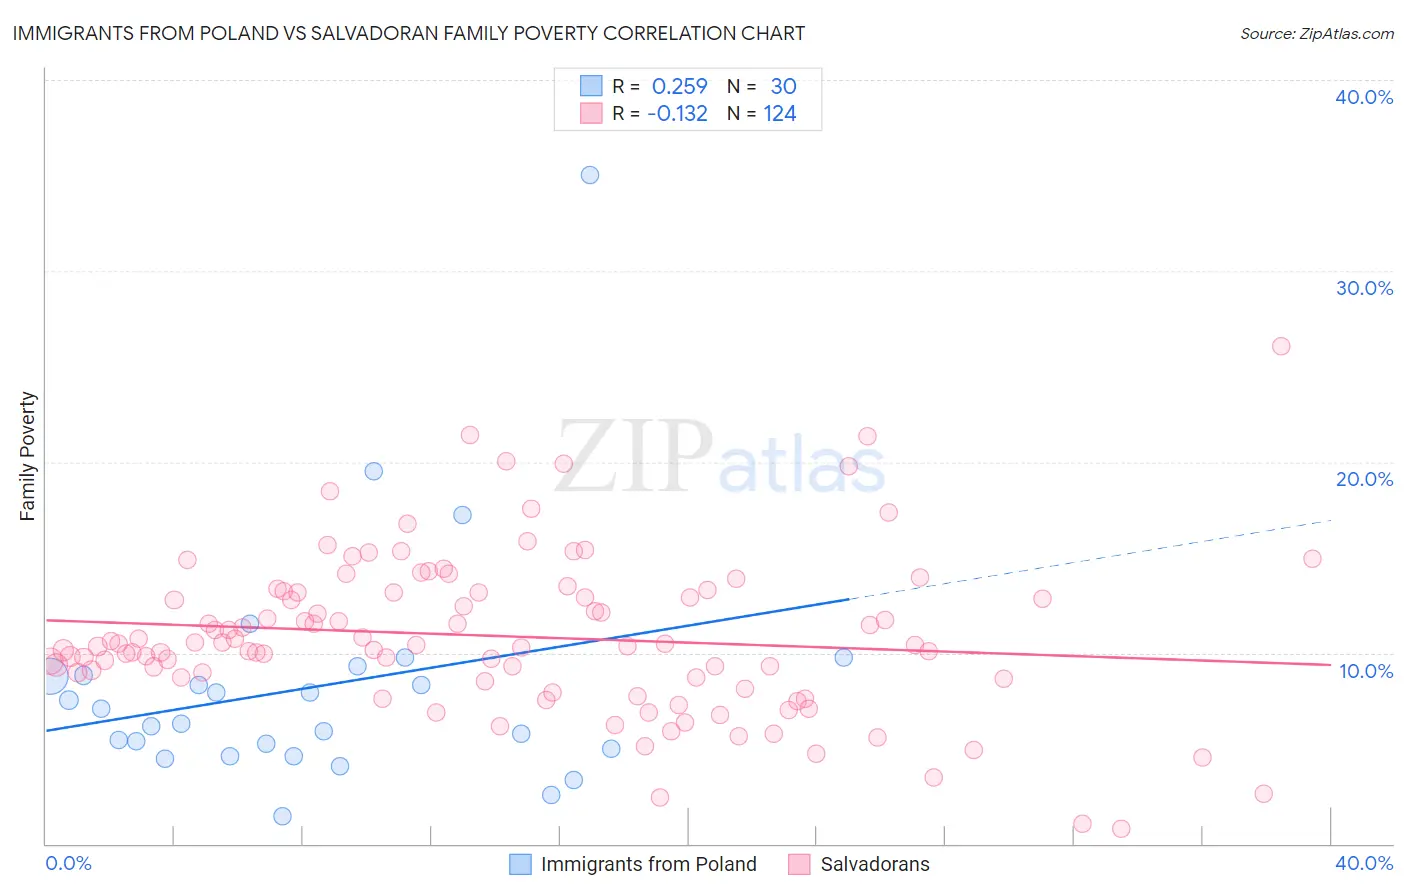
Immigrants from Poland vs Salvadoran Family Poverty Correlation Chart
The statistical analysis conducted on geographies consisting of 304,048,718 people shows a weak positive correlation between the proportion of Immigrants from Poland and poverty level among families in the United States with a correlation coefficient (R) of 0.259 and weighted average of 7.9%. Similarly, the statistical analysis conducted on geographies consisting of 398,019,620 people shows a poor negative correlation between the proportion of Salvadorans and poverty level among families in the United States with a correlation coefficient (R) of -0.132 and weighted average of 10.7%, a difference of 35.5%.
Family Poverty Correlation Summary
| Measurement | Immigrants from Poland | Salvadoran |
| Minimum | 1.5% | 0.79% |
| Maximum | 35.0% | 26.0% |
| Range | 33.5% | 25.3% |
| Mean | 8.2% | 10.9% |
| Median | 6.7% | 10.4% |
| Interquartile 25% (IQ1) | 5.0% | 8.7% |
| Interquartile 75% (IQ3) | 8.8% | 13.2% |
| Interquartile Range (IQR) | 3.8% | 4.5% |
| Standard Deviation (Sample) | 6.3% | 4.2% |
| Standard Deviation (Population) | 6.2% | 4.1% |
Similar Demographics by Family Poverty
Demographics Similar to Immigrants from Poland by Family Poverty
In terms of family poverty, the demographic groups most similar to Immigrants from Poland are English (7.9%, a difference of 0.030%), Irish (7.9%, a difference of 0.030%), Immigrants from Europe (7.9%, a difference of 0.090%), Immigrants from North America (7.9%, a difference of 0.17%), and Slovak (7.9%, a difference of 0.18%).
| Demographics | Rating | Rank | Family Poverty |
| Immigrants | Croatia | 98.1 /100 | #75 | Exceptional 7.8% |
| Immigrants | Latvia | 98.0 /100 | #76 | Exceptional 7.9% |
| Ukrainians | 98.0 /100 | #77 | Exceptional 7.9% |
| Immigrants | North America | 97.9 /100 | #78 | Exceptional 7.9% |
| Immigrants | Europe | 97.8 /100 | #79 | Exceptional 7.9% |
| English | 97.8 /100 | #80 | Exceptional 7.9% |
| Irish | 97.8 /100 | #81 | Exceptional 7.9% |
| Immigrants | Poland | 97.8 /100 | #82 | Exceptional 7.9% |
| Slovaks | 97.7 /100 | #83 | Exceptional 7.9% |
| British | 97.5 /100 | #84 | Exceptional 7.9% |
| Immigrants | Asia | 97.4 /100 | #85 | Exceptional 7.9% |
| Scottish | 97.3 /100 | #86 | Exceptional 7.9% |
| Belgians | 97.3 /100 | #87 | Exceptional 8.0% |
| Serbians | 97.2 /100 | #88 | Exceptional 8.0% |
| Immigrants | Denmark | 97.1 /100 | #89 | Exceptional 8.0% |
Demographics Similar to Salvadorans by Family Poverty
In terms of family poverty, the demographic groups most similar to Salvadorans are Iroquois (10.7%, a difference of 0.28%), Immigrants from Zaire (10.7%, a difference of 0.40%), Immigrants from Western Africa (10.7%, a difference of 0.51%), Cuban (10.6%, a difference of 0.53%), and Nicaraguan (10.6%, a difference of 0.57%).
| Demographics | Rating | Rank | Family Poverty |
| Nepalese | 0.8 /100 | #243 | Tragic 10.4% |
| Cree | 0.7 /100 | #244 | Tragic 10.5% |
| Immigrants | Burma/Myanmar | 0.6 /100 | #245 | Tragic 10.5% |
| Cherokee | 0.5 /100 | #246 | Tragic 10.6% |
| Liberians | 0.4 /100 | #247 | Tragic 10.6% |
| Nicaraguans | 0.4 /100 | #248 | Tragic 10.6% |
| Cubans | 0.4 /100 | #249 | Tragic 10.6% |
| Salvadorans | 0.3 /100 | #250 | Tragic 10.7% |
| Iroquois | 0.3 /100 | #251 | Tragic 10.7% |
| Immigrants | Zaire | 0.3 /100 | #252 | Tragic 10.7% |
| Immigrants | Western Africa | 0.3 /100 | #253 | Tragic 10.7% |
| Ecuadorians | 0.2 /100 | #254 | Tragic 10.8% |
| Immigrants | Liberia | 0.2 /100 | #255 | Tragic 10.8% |
| Chickasaw | 0.2 /100 | #256 | Tragic 10.8% |
| Immigrants | Ghana | 0.2 /100 | #257 | Tragic 10.8% |