Immigrants from Poland vs Immigrants from Australia Single Mother Poverty
COMPARE
Immigrants from Poland
Immigrants from Australia
Single Mother Poverty
Single Mother Poverty Comparison
Immigrants from Poland
Immigrants from Australia
26.9%
SINGLE MOTHER POVERTY
99.8/ 100
METRIC RATING
48th/ 347
METRIC RANK
27.3%
SINGLE MOTHER POVERTY
99.5/ 100
METRIC RATING
67th/ 347
METRIC RANK
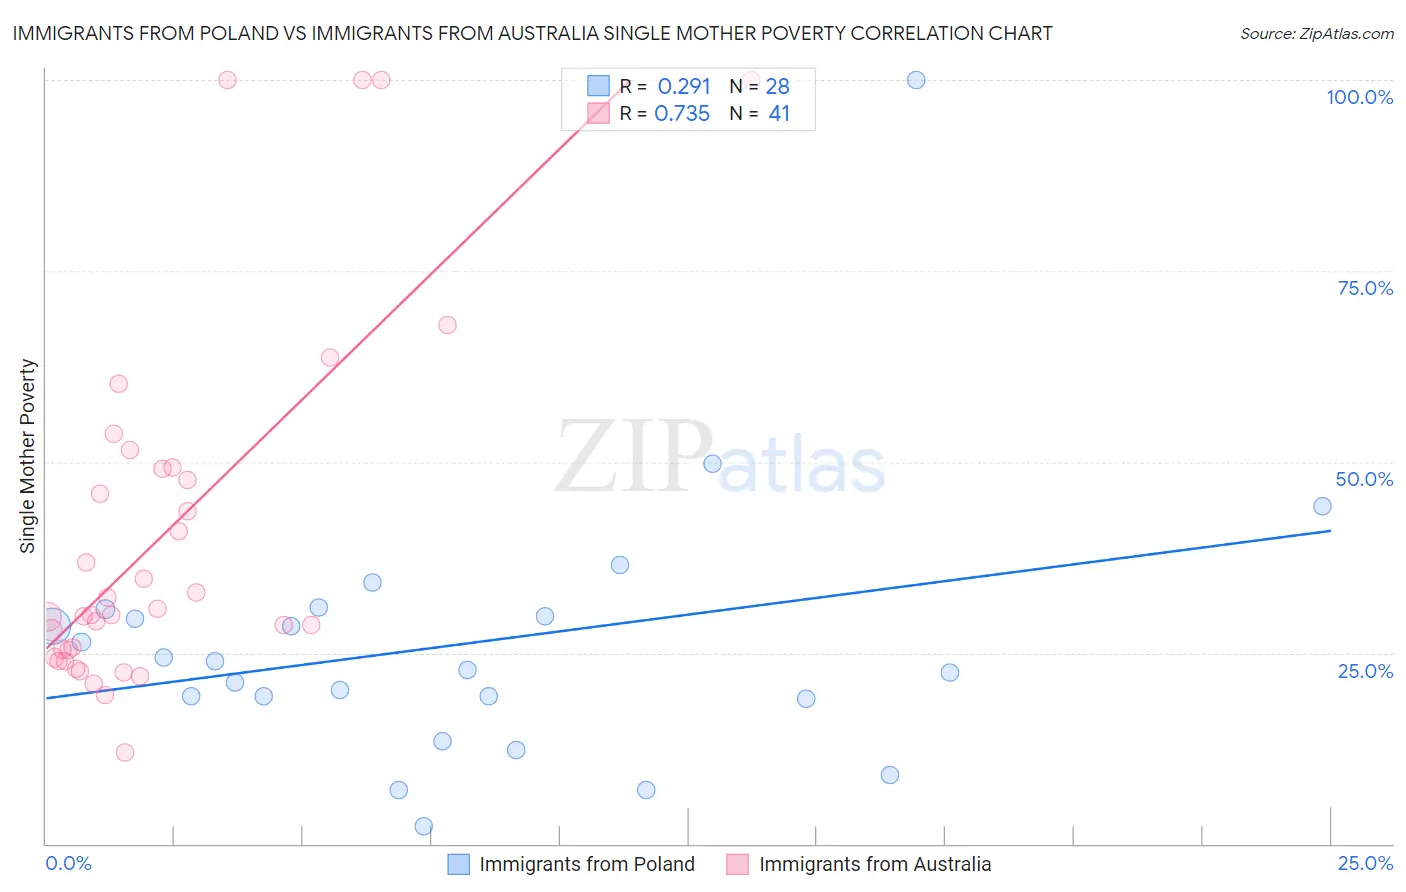
Immigrants from Poland vs Immigrants from Australia Single Mother Poverty Correlation Chart
The statistical analysis conducted on geographies consisting of 296,747,153 people shows a weak positive correlation between the proportion of Immigrants from Poland and poverty level among single mothers in the United States with a correlation coefficient (R) of 0.291 and weighted average of 26.9%. Similarly, the statistical analysis conducted on geographies consisting of 222,815,185 people shows a strong positive correlation between the proportion of Immigrants from Australia and poverty level among single mothers in the United States with a correlation coefficient (R) of 0.735 and weighted average of 27.3%, a difference of 1.5%.
Single Mother Poverty Correlation Summary
| Measurement | Immigrants from Poland | Immigrants from Australia |
| Minimum | 2.2% | 11.9% |
| Maximum | 100.0% | 100.0% |
| Range | 97.8% | 88.1% |
| Mean | 26.1% | 40.6% |
| Median | 23.3% | 30.0% |
| Interquartile 25% (IQ1) | 19.2% | 24.9% |
| Interquartile 75% (IQ3) | 30.2% | 49.2% |
| Interquartile Range (IQR) | 11.1% | 24.3% |
| Standard Deviation (Sample) | 18.1% | 23.5% |
| Standard Deviation (Population) | 17.7% | 23.2% |
Demographics Similar to Immigrants from Poland and Immigrants from Australia by Single Mother Poverty
In terms of single mother poverty, the demographic groups most similar to Immigrants from Poland are Egyptian (26.9%, a difference of 0.080%), Cambodian (27.0%, a difference of 0.080%), Laotian (27.0%, a difference of 0.090%), Immigrants from Argentina (27.1%, a difference of 0.64%), and Immigrants from South Eastern Asia (27.1%, a difference of 0.68%). Similarly, the demographic groups most similar to Immigrants from Australia are Soviet Union (27.3%, a difference of 0.020%), Immigrants from Turkey (27.3%, a difference of 0.060%), Russian (27.3%, a difference of 0.14%), Immigrants from Northern Europe (27.3%, a difference of 0.17%), and Immigrants from Malaysia (27.3%, a difference of 0.22%).
| Demographics | Rating | Rank | Single Mother Poverty |
| Egyptians | 99.8 /100 | #47 | Exceptional 26.9% |
| Immigrants | Poland | 99.8 /100 | #48 | Exceptional 26.9% |
| Cambodians | 99.8 /100 | #49 | Exceptional 27.0% |
| Laotians | 99.8 /100 | #50 | Exceptional 27.0% |
| Immigrants | Argentina | 99.7 /100 | #51 | Exceptional 27.1% |
| Immigrants | South Eastern Asia | 99.7 /100 | #52 | Exceptional 27.1% |
| Immigrants | Jordan | 99.7 /100 | #53 | Exceptional 27.1% |
| Immigrants | Bulgaria | 99.7 /100 | #54 | Exceptional 27.1% |
| Immigrants | Egypt | 99.7 /100 | #55 | Exceptional 27.1% |
| Immigrants | Romania | 99.7 /100 | #56 | Exceptional 27.2% |
| Palestinians | 99.7 /100 | #57 | Exceptional 27.2% |
| Argentineans | 99.6 /100 | #58 | Exceptional 27.2% |
| Paraguayans | 99.6 /100 | #59 | Exceptional 27.2% |
| Eastern Europeans | 99.6 /100 | #60 | Exceptional 27.2% |
| Immigrants | Eastern Europe | 99.6 /100 | #61 | Exceptional 27.2% |
| Immigrants | Malaysia | 99.5 /100 | #62 | Exceptional 27.3% |
| Immigrants | Northern Europe | 99.5 /100 | #63 | Exceptional 27.3% |
| Russians | 99.5 /100 | #64 | Exceptional 27.3% |
| Immigrants | Turkey | 99.5 /100 | #65 | Exceptional 27.3% |
| Soviet Union | 99.5 /100 | #66 | Exceptional 27.3% |
| Immigrants | Australia | 99.5 /100 | #67 | Exceptional 27.3% |