Immigrants from Philippines vs Taiwanese 2nd Grade
COMPARE
Immigrants from Philippines
Taiwanese
2nd Grade
2nd Grade Comparison
Immigrants from Philippines
Taiwanese
97.3%
2ND GRADE
0.1/ 100
METRIC RATING
276th/ 347
METRIC RANK
97.4%
2ND GRADE
0.4/ 100
METRIC RATING
262nd/ 347
METRIC RANK
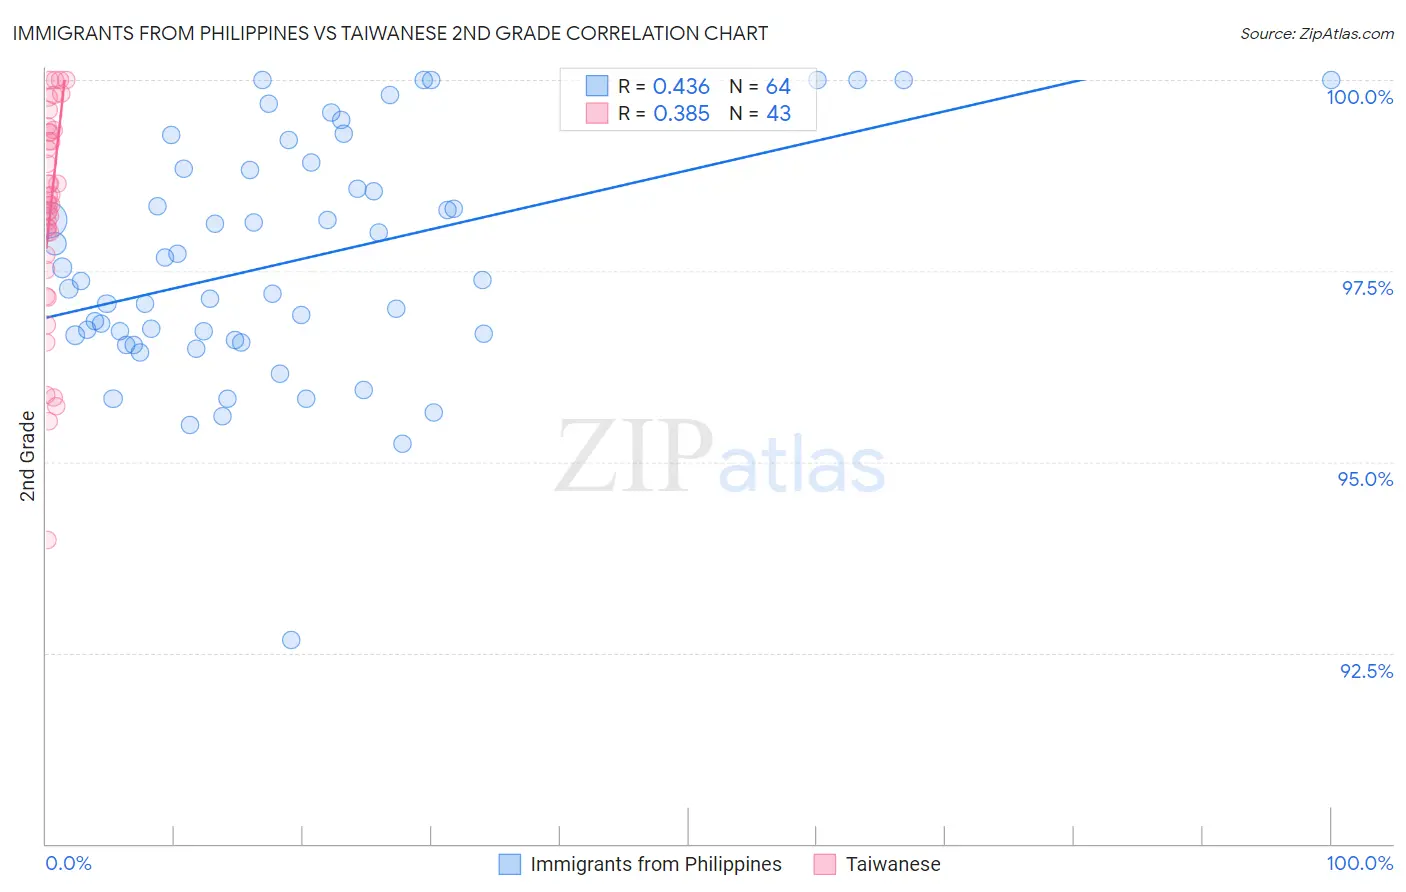
Immigrants from Philippines vs Taiwanese 2nd Grade Correlation Chart
The statistical analysis conducted on geographies consisting of 471,303,140 people shows a moderate positive correlation between the proportion of Immigrants from Philippines and percentage of population with at least 2nd grade education in the United States with a correlation coefficient (R) of 0.436 and weighted average of 97.3%. Similarly, the statistical analysis conducted on geographies consisting of 31,677,387 people shows a mild positive correlation between the proportion of Taiwanese and percentage of population with at least 2nd grade education in the United States with a correlation coefficient (R) of 0.385 and weighted average of 97.4%, a difference of 0.13%.
2nd Grade Correlation Summary
| Measurement | Immigrants from Philippines | Taiwanese |
| Minimum | 92.7% | 94.0% |
| Maximum | 100.0% | 100.0% |
| Range | 7.3% | 6.0% |
| Mean | 97.6% | 98.3% |
| Median | 97.4% | 98.4% |
| Interquartile 25% (IQ1) | 96.6% | 97.7% |
| Interquartile 75% (IQ3) | 98.8% | 99.3% |
| Interquartile Range (IQR) | 2.2% | 1.6% |
| Standard Deviation (Sample) | 1.5% | 1.4% |
| Standard Deviation (Population) | 1.5% | 1.4% |
Demographics Similar to Immigrants from Philippines and Taiwanese by 2nd Grade
In terms of 2nd grade, the demographic groups most similar to Immigrants from Philippines are Immigrants from Western Africa (97.3%, a difference of 0.0%), Immigrants from Uzbekistan (97.3%, a difference of 0.010%), Immigrants from Ghana (97.3%, a difference of 0.020%), Ghanaian (97.4%, a difference of 0.030%), and Immigrants from China (97.3%, a difference of 0.030%). Similarly, the demographic groups most similar to Taiwanese are Immigrants from Ethiopia (97.4%, a difference of 0.0%), Immigrants from Liberia (97.4%, a difference of 0.0%), Immigrants from South America (97.4%, a difference of 0.0%), Assyrian/Chaldean/Syriac (97.5%, a difference of 0.010%), and Armenian (97.5%, a difference of 0.010%).
| Demographics | Rating | Rank | 2nd Grade |
| Fijians | 0.5 /100 | #259 | Tragic 97.5% |
| Assyrians/Chaldeans/Syriacs | 0.5 /100 | #260 | Tragic 97.5% |
| Armenians | 0.5 /100 | #261 | Tragic 97.5% |
| Taiwanese | 0.4 /100 | #262 | Tragic 97.4% |
| Immigrants | Ethiopia | 0.4 /100 | #263 | Tragic 97.4% |
| Immigrants | Liberia | 0.4 /100 | #264 | Tragic 97.4% |
| Immigrants | South America | 0.4 /100 | #265 | Tragic 97.4% |
| Immigrants | Sierra Leone | 0.4 /100 | #266 | Tragic 97.4% |
| Cubans | 0.3 /100 | #267 | Tragic 97.4% |
| Immigrants | Nigeria | 0.3 /100 | #268 | Tragic 97.4% |
| West Indians | 0.3 /100 | #269 | Tragic 97.4% |
| Immigrants | Jamaica | 0.2 /100 | #270 | Tragic 97.4% |
| Immigrants | Cameroon | 0.2 /100 | #271 | Tragic 97.4% |
| Immigrants | Peru | 0.1 /100 | #272 | Tragic 97.4% |
| Immigrants | Bolivia | 0.1 /100 | #273 | Tragic 97.4% |
| Ghanaians | 0.1 /100 | #274 | Tragic 97.4% |
| Immigrants | China | 0.1 /100 | #275 | Tragic 97.3% |
| Immigrants | Philippines | 0.1 /100 | #276 | Tragic 97.3% |
| Immigrants | Western Africa | 0.1 /100 | #277 | Tragic 97.3% |
| Immigrants | Uzbekistan | 0.1 /100 | #278 | Tragic 97.3% |
| Immigrants | Ghana | 0.1 /100 | #279 | Tragic 97.3% |