Immigrants from Bosnia and Herzegovina vs Taiwanese Family Poverty
COMPARE
Immigrants from Bosnia and Herzegovina
Taiwanese
Family Poverty
Family Poverty Comparison
Immigrants from Bosnia and Herzegovina
Taiwanese
8.4%
FAMILY POVERTY
88.6/ 100
METRIC RATING
130th/ 347
METRIC RANK
8.2%
FAMILY POVERTY
94.6/ 100
METRIC RATING
111th/ 347
METRIC RANK
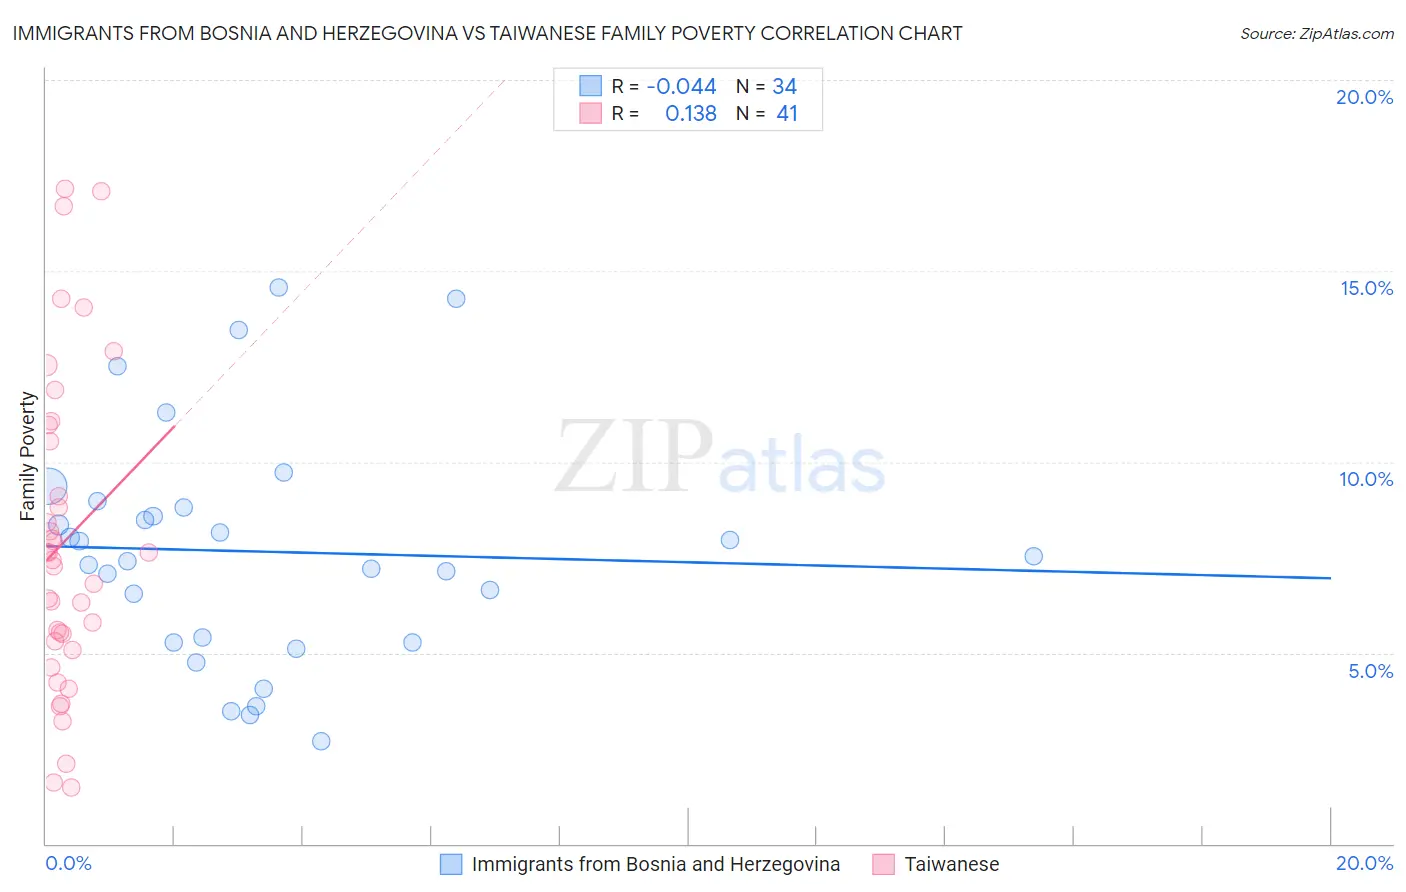
Immigrants from Bosnia and Herzegovina vs Taiwanese Family Poverty Correlation Chart
The statistical analysis conducted on geographies consisting of 156,590,681 people shows no correlation between the proportion of Immigrants from Bosnia and Herzegovina and poverty level among families in the United States with a correlation coefficient (R) of -0.044 and weighted average of 8.4%. Similarly, the statistical analysis conducted on geographies consisting of 31,669,641 people shows a poor positive correlation between the proportion of Taiwanese and poverty level among families in the United States with a correlation coefficient (R) of 0.138 and weighted average of 8.2%, a difference of 2.9%.
Family Poverty Correlation Summary
| Measurement | Immigrants from Bosnia and Herzegovina | Taiwanese |
| Minimum | 2.7% | 1.5% |
| Maximum | 14.6% | 17.2% |
| Range | 11.9% | 15.7% |
| Mean | 7.7% | 7.9% |
| Median | 7.5% | 7.4% |
| Interquartile 25% (IQ1) | 5.3% | 5.2% |
| Interquartile 75% (IQ3) | 8.8% | 10.8% |
| Interquartile Range (IQR) | 3.5% | 5.6% |
| Standard Deviation (Sample) | 3.0% | 4.1% |
| Standard Deviation (Population) | 3.0% | 4.1% |
Demographics Similar to Immigrants from Bosnia and Herzegovina and Taiwanese by Family Poverty
In terms of family poverty, the demographic groups most similar to Immigrants from Bosnia and Herzegovina are Portuguese (8.4%, a difference of 0.18%), Argentinean (8.4%, a difference of 0.34%), Immigrants from Hungary (8.4%, a difference of 0.48%), Icelander (8.3%, a difference of 0.61%), and Pakistani (8.3%, a difference of 0.81%). Similarly, the demographic groups most similar to Taiwanese are Romanian (8.2%, a difference of 0.060%), Immigrants from France (8.2%, a difference of 0.11%), Canadian (8.2%, a difference of 0.28%), Immigrants from Zimbabwe (8.2%, a difference of 0.37%), and Immigrants from Israel (8.2%, a difference of 0.72%).
| Demographics | Rating | Rank | Family Poverty |
| Romanians | 94.7 /100 | #110 | Exceptional 8.2% |
| Taiwanese | 94.6 /100 | #111 | Exceptional 8.2% |
| Immigrants | France | 94.4 /100 | #112 | Exceptional 8.2% |
| Canadians | 94.2 /100 | #113 | Exceptional 8.2% |
| Immigrants | Zimbabwe | 94.0 /100 | #114 | Exceptional 8.2% |
| Immigrants | Israel | 93.5 /100 | #115 | Exceptional 8.2% |
| South Africans | 93.4 /100 | #116 | Exceptional 8.2% |
| Immigrants | Russia | 93.2 /100 | #117 | Exceptional 8.2% |
| Immigrants | Western Europe | 92.9 /100 | #118 | Exceptional 8.2% |
| French | 92.8 /100 | #119 | Exceptional 8.3% |
| Immigrants | Egypt | 91.6 /100 | #120 | Exceptional 8.3% |
| Native Hawaiians | 91.3 /100 | #121 | Exceptional 8.3% |
| Paraguayans | 91.2 /100 | #122 | Exceptional 8.3% |
| Palestinians | 91.1 /100 | #123 | Exceptional 8.3% |
| Soviet Union | 90.8 /100 | #124 | Exceptional 8.3% |
| Pakistanis | 90.8 /100 | #125 | Exceptional 8.3% |
| Icelanders | 90.3 /100 | #126 | Exceptional 8.3% |
| Immigrants | Hungary | 89.9 /100 | #127 | Excellent 8.4% |
| Argentineans | 89.6 /100 | #128 | Excellent 8.4% |
| Portuguese | 89.2 /100 | #129 | Excellent 8.4% |
| Immigrants | Bosnia and Herzegovina | 88.6 /100 | #130 | Excellent 8.4% |