Immigrants from Zaire vs Immigrants from Kenya Child Poverty Under the Age of 5
COMPARE
Immigrants from Zaire
Immigrants from Kenya
Child Poverty Under the Age of 5
Child Poverty Under the Age of 5 Comparison
Immigrants from Zaire
Immigrants from Kenya
21.3%
CHILD POVERTY UNDER THE AGE OF 5
0.0/ 100
METRIC RATING
287th/ 347
METRIC RANK
17.9%
CHILD POVERTY UNDER THE AGE OF 5
20.0/ 100
METRIC RATING
197th/ 347
METRIC RANK
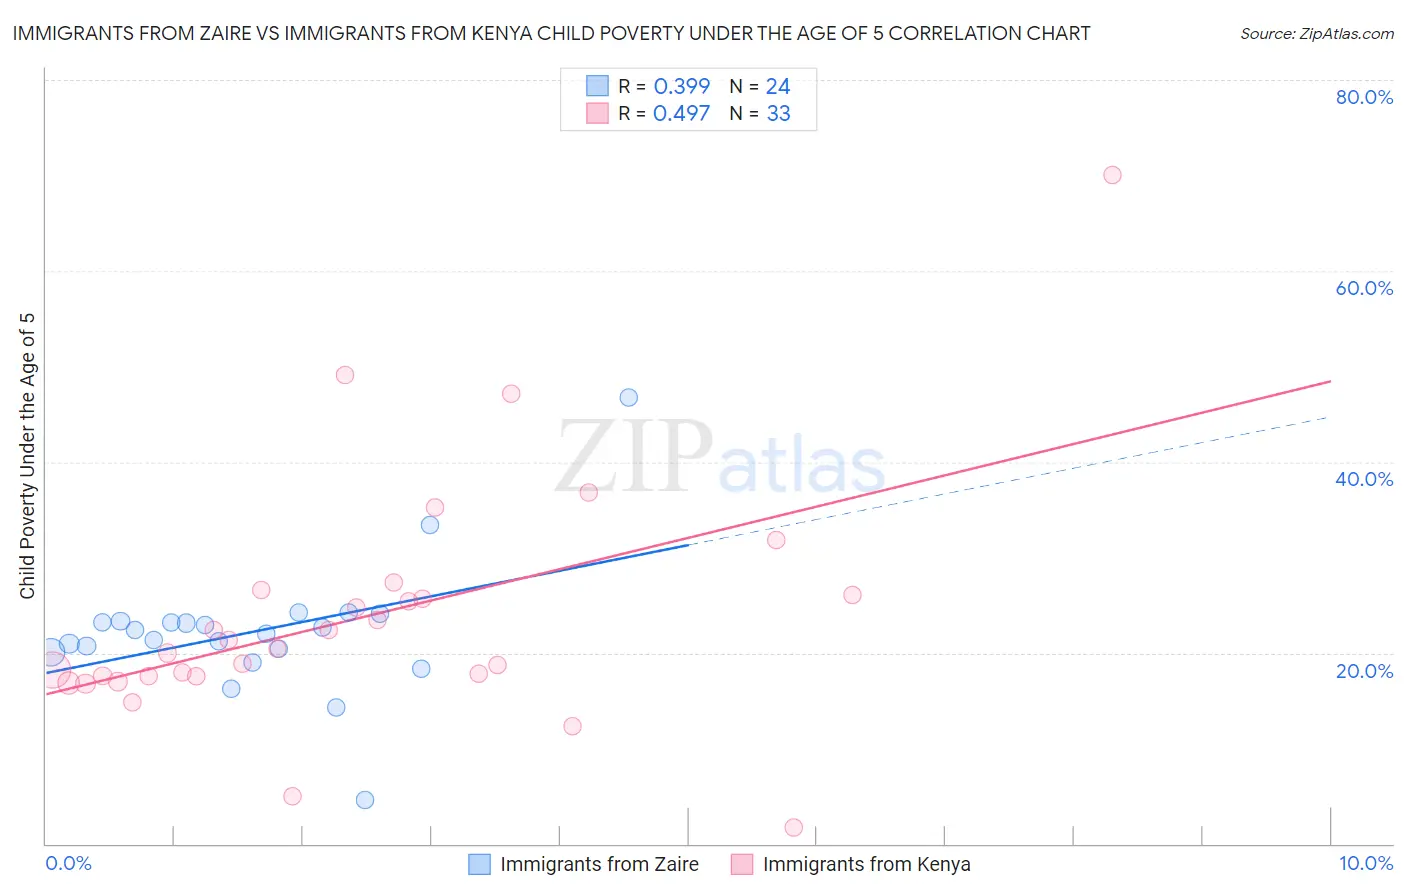
Immigrants from Zaire vs Immigrants from Kenya Child Poverty Under the Age of 5 Correlation Chart
The statistical analysis conducted on geographies consisting of 106,157,538 people shows a mild positive correlation between the proportion of Immigrants from Zaire and poverty level among children under the age of 5 in the United States with a correlation coefficient (R) of 0.399 and weighted average of 21.3%. Similarly, the statistical analysis conducted on geographies consisting of 213,748,262 people shows a moderate positive correlation between the proportion of Immigrants from Kenya and poverty level among children under the age of 5 in the United States with a correlation coefficient (R) of 0.497 and weighted average of 17.9%, a difference of 19.0%.
Child Poverty Under the Age of 5 Correlation Summary
| Measurement | Immigrants from Zaire | Immigrants from Kenya |
| Minimum | 4.6% | 1.7% |
| Maximum | 46.8% | 70.0% |
| Range | 42.2% | 68.3% |
| Mean | 22.2% | 23.8% |
| Median | 22.2% | 20.4% |
| Interquartile 25% (IQ1) | 20.3% | 17.5% |
| Interquartile 75% (IQ3) | 23.3% | 26.3% |
| Interquartile Range (IQR) | 3.0% | 8.8% |
| Standard Deviation (Sample) | 7.2% | 12.8% |
| Standard Deviation (Population) | 7.0% | 12.6% |
Similar Demographics by Child Poverty Under the Age of 5
Demographics Similar to Immigrants from Zaire by Child Poverty Under the Age of 5
In terms of child poverty under the age of 5, the demographic groups most similar to Immigrants from Zaire are Immigrants from Latin America (21.2%, a difference of 0.090%), Haitian (21.2%, a difference of 0.17%), Immigrants from Senegal (21.3%, a difference of 0.17%), Immigrants from Haiti (21.3%, a difference of 0.25%), and Somali (21.1%, a difference of 0.64%).
| Demographics | Rating | Rank | Child Poverty Under the Age of 5 |
| French American Indians | 0.0 /100 | #280 | Tragic 20.8% |
| Senegalese | 0.0 /100 | #281 | Tragic 20.9% |
| Potawatomi | 0.0 /100 | #282 | Tragic 21.0% |
| Comanche | 0.0 /100 | #283 | Tragic 21.0% |
| Somalis | 0.0 /100 | #284 | Tragic 21.1% |
| Haitians | 0.0 /100 | #285 | Tragic 21.2% |
| Immigrants | Latin America | 0.0 /100 | #286 | Tragic 21.2% |
| Immigrants | Zaire | 0.0 /100 | #287 | Tragic 21.3% |
| Immigrants | Senegal | 0.0 /100 | #288 | Tragic 21.3% |
| Immigrants | Haiti | 0.0 /100 | #289 | Tragic 21.3% |
| Immigrants | Caribbean | 0.0 /100 | #290 | Tragic 21.4% |
| British West Indians | 0.0 /100 | #291 | Tragic 21.4% |
| Immigrants | Somalia | 0.0 /100 | #292 | Tragic 21.6% |
| Mexicans | 0.0 /100 | #293 | Tragic 21.6% |
| Guatemalans | 0.0 /100 | #294 | Tragic 21.6% |
Demographics Similar to Immigrants from Kenya by Child Poverty Under the Age of 5
In terms of child poverty under the age of 5, the demographic groups most similar to Immigrants from Kenya are Celtic (17.9%, a difference of 0.28%), Hungarian (17.9%, a difference of 0.28%), Immigrants from Portugal (17.8%, a difference of 0.33%), Sierra Leonean (17.7%, a difference of 0.60%), and French Canadian (17.7%, a difference of 0.67%).
| Demographics | Rating | Rank | Child Poverty Under the Age of 5 |
| Slovaks | 29.2 /100 | #190 | Fair 17.6% |
| Immigrants | Afghanistan | 27.9 /100 | #191 | Fair 17.7% |
| Immigrants | Uruguay | 27.8 /100 | #192 | Fair 17.7% |
| Immigrants | Uganda | 25.0 /100 | #193 | Fair 17.7% |
| French Canadians | 24.6 /100 | #194 | Fair 17.7% |
| Sierra Leoneans | 24.1 /100 | #195 | Fair 17.7% |
| Immigrants | Portugal | 22.2 /100 | #196 | Fair 17.8% |
| Immigrants | Kenya | 20.0 /100 | #197 | Fair 17.9% |
| Celtics | 18.3 /100 | #198 | Poor 17.9% |
| Hungarians | 18.3 /100 | #199 | Poor 17.9% |
| Iraqis | 14.0 /100 | #200 | Poor 18.0% |
| Ugandans | 13.9 /100 | #201 | Poor 18.0% |
| Japanese | 13.8 /100 | #202 | Poor 18.1% |
| Immigrants | Cambodia | 13.7 /100 | #203 | Poor 18.1% |
| Immigrants | Eastern Africa | 13.4 /100 | #204 | Poor 18.1% |