Immigrants from Norway vs Immigrants from Sudan Child Poverty Under the Age of 5
COMPARE
Immigrants from Norway
Immigrants from Sudan
Child Poverty Under the Age of 5
Child Poverty Under the Age of 5 Comparison
Immigrants from Norway
Immigrants from Sudan
16.3%
CHILD POVERTY UNDER THE AGE OF 5
89.3/ 100
METRIC RATING
130th/ 347
METRIC RANK
19.2%
CHILD POVERTY UNDER THE AGE OF 5
1.3/ 100
METRIC RATING
228th/ 347
METRIC RANK
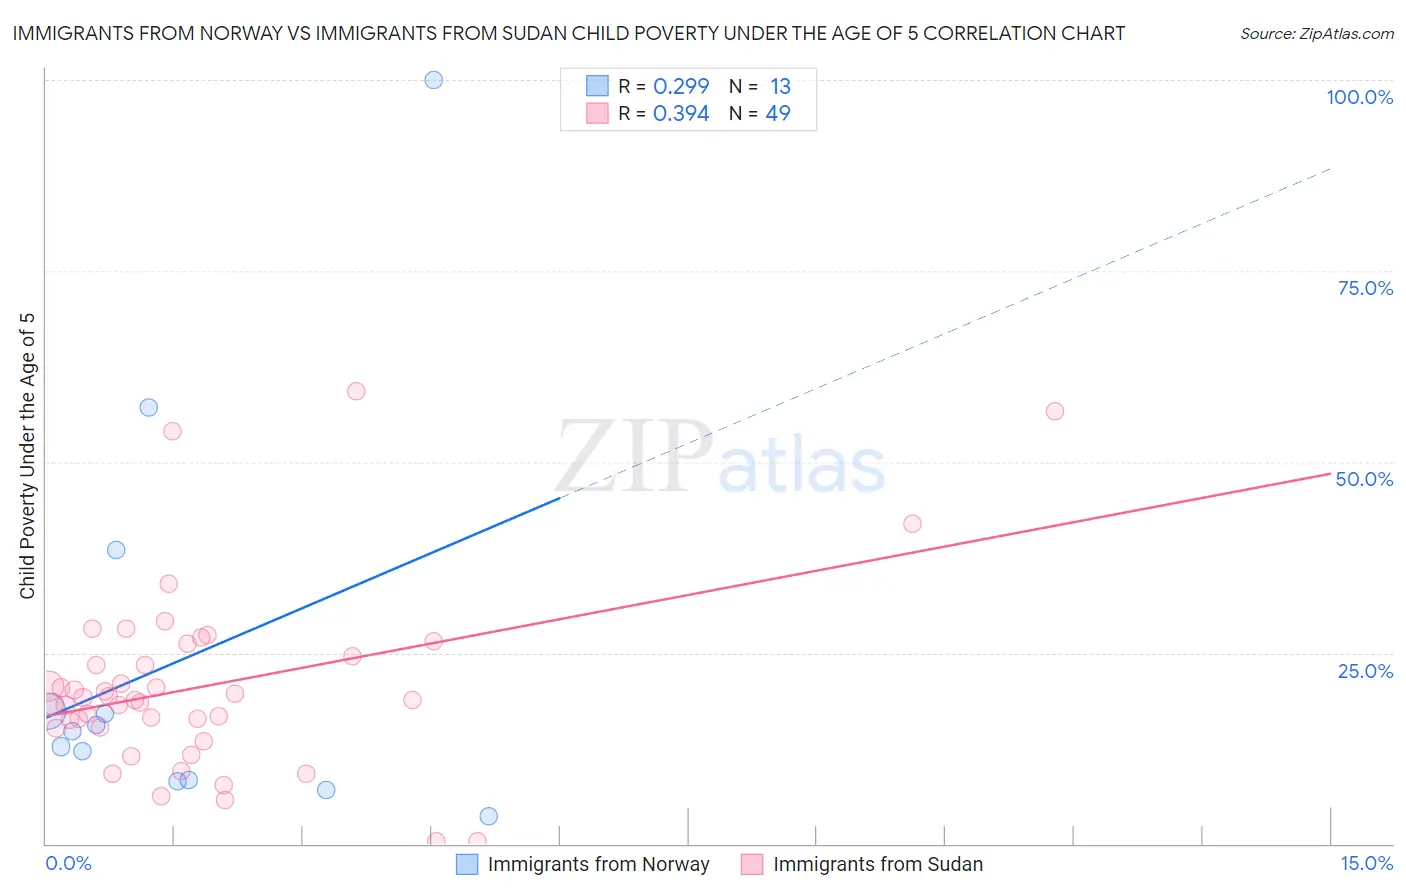
Immigrants from Norway vs Immigrants from Sudan Child Poverty Under the Age of 5 Correlation Chart
The statistical analysis conducted on geographies consisting of 114,119,932 people shows a weak positive correlation between the proportion of Immigrants from Norway and poverty level among children under the age of 5 in the United States with a correlation coefficient (R) of 0.299 and weighted average of 16.3%. Similarly, the statistical analysis conducted on geographies consisting of 117,972,836 people shows a mild positive correlation between the proportion of Immigrants from Sudan and poverty level among children under the age of 5 in the United States with a correlation coefficient (R) of 0.394 and weighted average of 19.2%, a difference of 17.8%.
Child Poverty Under the Age of 5 Correlation Summary
| Measurement | Immigrants from Norway | Immigrants from Sudan |
| Minimum | 3.6% | 0.35% |
| Maximum | 100.0% | 59.2% |
| Range | 96.4% | 58.9% |
| Mean | 24.0% | 20.7% |
| Median | 14.7% | 18.8% |
| Interquartile 25% (IQ1) | 8.3% | 15.2% |
| Interquartile 75% (IQ3) | 27.9% | 25.4% |
| Interquartile Range (IQR) | 19.6% | 10.2% |
| Standard Deviation (Sample) | 27.1% | 12.2% |
| Standard Deviation (Population) | 26.0% | 12.1% |
Similar Demographics by Child Poverty Under the Age of 5
Demographics Similar to Immigrants from Norway by Child Poverty Under the Age of 5
In terms of child poverty under the age of 5, the demographic groups most similar to Immigrants from Norway are British (16.3%, a difference of 0.030%), South African (16.2%, a difference of 0.21%), Finnish (16.3%, a difference of 0.29%), Serbian (16.3%, a difference of 0.32%), and Icelander (16.3%, a difference of 0.39%).
| Demographics | Rating | Rank | Child Poverty Under the Age of 5 |
| Austrians | 92.0 /100 | #123 | Exceptional 16.1% |
| Swiss | 92.0 /100 | #124 | Exceptional 16.1% |
| Native Hawaiians | 91.8 /100 | #125 | Exceptional 16.2% |
| Immigrants | Albania | 91.8 /100 | #126 | Exceptional 16.2% |
| Immigrants | England | 91.5 /100 | #127 | Exceptional 16.2% |
| South Africans | 90.1 /100 | #128 | Exceptional 16.2% |
| British | 89.4 /100 | #129 | Excellent 16.3% |
| Immigrants | Norway | 89.3 /100 | #130 | Excellent 16.3% |
| Finns | 88.3 /100 | #131 | Excellent 16.3% |
| Serbians | 88.2 /100 | #132 | Excellent 16.3% |
| Icelanders | 87.9 /100 | #133 | Excellent 16.3% |
| Immigrants | North Macedonia | 87.8 /100 | #134 | Excellent 16.4% |
| Brazilians | 87.8 /100 | #135 | Excellent 16.4% |
| Immigrants | Northern Africa | 87.5 /100 | #136 | Excellent 16.4% |
| Immigrants | Chile | 85.3 /100 | #137 | Excellent 16.4% |
Demographics Similar to Immigrants from Sudan by Child Poverty Under the Age of 5
In terms of child poverty under the age of 5, the demographic groups most similar to Immigrants from Sudan are Ghanaian (19.2%, a difference of 0.080%), Ecuadorian (19.2%, a difference of 0.12%), Bermudan (19.2%, a difference of 0.17%), Cape Verdean (19.1%, a difference of 0.30%), and Immigrants from Eritrea (19.1%, a difference of 0.49%).
| Demographics | Rating | Rank | Child Poverty Under the Age of 5 |
| Immigrants | Nigeria | 2.1 /100 | #221 | Tragic 19.0% |
| Alsatians | 1.7 /100 | #222 | Tragic 19.1% |
| Cubans | 1.7 /100 | #223 | Tragic 19.1% |
| Nicaraguans | 1.6 /100 | #224 | Tragic 19.1% |
| Nigerians | 1.6 /100 | #225 | Tragic 19.1% |
| Immigrants | Eritrea | 1.5 /100 | #226 | Tragic 19.1% |
| Cape Verdeans | 1.4 /100 | #227 | Tragic 19.1% |
| Immigrants | Sudan | 1.3 /100 | #228 | Tragic 19.2% |
| Ghanaians | 1.2 /100 | #229 | Tragic 19.2% |
| Ecuadorians | 1.2 /100 | #230 | Tragic 19.2% |
| Bermudans | 1.2 /100 | #231 | Tragic 19.2% |
| Trinidadians and Tobagonians | 0.9 /100 | #232 | Tragic 19.3% |
| Sudanese | 0.9 /100 | #233 | Tragic 19.3% |
| Immigrants | Micronesia | 0.9 /100 | #234 | Tragic 19.4% |
| Immigrants | Laos | 0.8 /100 | #235 | Tragic 19.4% |