Immigrants from Norway vs Immigrants from Cuba Child Poverty Under the Age of 5
COMPARE
Immigrants from Norway
Immigrants from Cuba
Child Poverty Under the Age of 5
Child Poverty Under the Age of 5 Comparison
Immigrants from Norway
Immigrants from Cuba
16.3%
CHILD POVERTY UNDER THE AGE OF 5
89.3/ 100
METRIC RATING
130th/ 347
METRIC RANK
19.9%
CHILD POVERTY UNDER THE AGE OF 5
0.2/ 100
METRIC RATING
255th/ 347
METRIC RANK
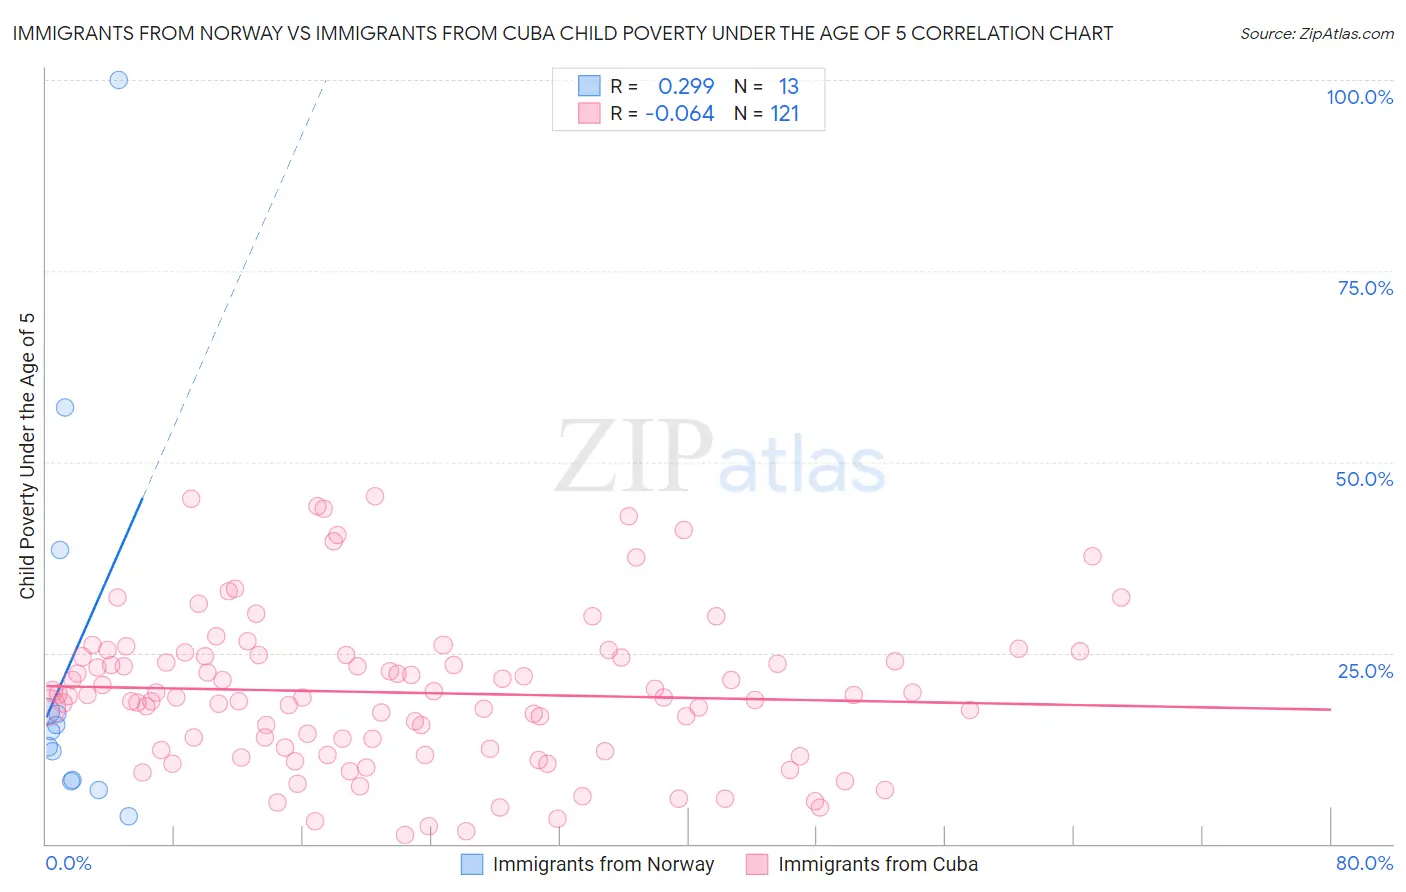
Immigrants from Norway vs Immigrants from Cuba Child Poverty Under the Age of 5 Correlation Chart
The statistical analysis conducted on geographies consisting of 114,119,932 people shows a weak positive correlation between the proportion of Immigrants from Norway and poverty level among children under the age of 5 in the United States with a correlation coefficient (R) of 0.299 and weighted average of 16.3%. Similarly, the statistical analysis conducted on geographies consisting of 316,135,095 people shows a slight negative correlation between the proportion of Immigrants from Cuba and poverty level among children under the age of 5 in the United States with a correlation coefficient (R) of -0.064 and weighted average of 19.9%, a difference of 22.4%.
Child Poverty Under the Age of 5 Correlation Summary
| Measurement | Immigrants from Norway | Immigrants from Cuba |
| Minimum | 3.6% | 1.1% |
| Maximum | 100.0% | 45.5% |
| Range | 96.4% | 44.3% |
| Mean | 24.0% | 19.8% |
| Median | 14.7% | 19.3% |
| Interquartile 25% (IQ1) | 8.3% | 12.3% |
| Interquartile 75% (IQ3) | 27.9% | 24.6% |
| Interquartile Range (IQR) | 19.6% | 12.3% |
| Standard Deviation (Sample) | 27.1% | 9.9% |
| Standard Deviation (Population) | 26.0% | 9.9% |
Similar Demographics by Child Poverty Under the Age of 5
Demographics Similar to Immigrants from Norway by Child Poverty Under the Age of 5
In terms of child poverty under the age of 5, the demographic groups most similar to Immigrants from Norway are British (16.3%, a difference of 0.030%), South African (16.2%, a difference of 0.21%), Finnish (16.3%, a difference of 0.29%), Serbian (16.3%, a difference of 0.32%), and Icelander (16.3%, a difference of 0.39%).
| Demographics | Rating | Rank | Child Poverty Under the Age of 5 |
| Austrians | 92.0 /100 | #123 | Exceptional 16.1% |
| Swiss | 92.0 /100 | #124 | Exceptional 16.1% |
| Native Hawaiians | 91.8 /100 | #125 | Exceptional 16.2% |
| Immigrants | Albania | 91.8 /100 | #126 | Exceptional 16.2% |
| Immigrants | England | 91.5 /100 | #127 | Exceptional 16.2% |
| South Africans | 90.1 /100 | #128 | Exceptional 16.2% |
| British | 89.4 /100 | #129 | Excellent 16.3% |
| Immigrants | Norway | 89.3 /100 | #130 | Excellent 16.3% |
| Finns | 88.3 /100 | #131 | Excellent 16.3% |
| Serbians | 88.2 /100 | #132 | Excellent 16.3% |
| Icelanders | 87.9 /100 | #133 | Excellent 16.3% |
| Immigrants | North Macedonia | 87.8 /100 | #134 | Excellent 16.4% |
| Brazilians | 87.8 /100 | #135 | Excellent 16.4% |
| Immigrants | Northern Africa | 87.5 /100 | #136 | Excellent 16.4% |
| Immigrants | Chile | 85.3 /100 | #137 | Excellent 16.4% |
Demographics Similar to Immigrants from Cuba by Child Poverty Under the Age of 5
In terms of child poverty under the age of 5, the demographic groups most similar to Immigrants from Cuba are Fijian (19.9%, a difference of 0.10%), Immigrants from Barbados (20.0%, a difference of 0.22%), Shoshone (20.0%, a difference of 0.23%), Mexican American Indian (19.9%, a difference of 0.25%), and Immigrants from St. Vincent and the Grenadines (20.0%, a difference of 0.37%).
| Demographics | Rating | Rank | Child Poverty Under the Age of 5 |
| Marshallese | 0.4 /100 | #248 | Tragic 19.7% |
| Immigrants | Middle Africa | 0.4 /100 | #249 | Tragic 19.7% |
| Immigrants | Nonimmigrants | 0.4 /100 | #250 | Tragic 19.7% |
| Pennsylvania Germans | 0.3 /100 | #251 | Tragic 19.8% |
| Immigrants | Nicaragua | 0.3 /100 | #252 | Tragic 19.8% |
| Mexican American Indians | 0.3 /100 | #253 | Tragic 19.9% |
| Fijians | 0.3 /100 | #254 | Tragic 19.9% |
| Immigrants | Cuba | 0.2 /100 | #255 | Tragic 19.9% |
| Immigrants | Barbados | 0.2 /100 | #256 | Tragic 20.0% |
| Shoshone | 0.2 /100 | #257 | Tragic 20.0% |
| Immigrants | St. Vincent and the Grenadines | 0.2 /100 | #258 | Tragic 20.0% |
| Immigrants | El Salvador | 0.2 /100 | #259 | Tragic 20.0% |
| Spanish Americans | 0.2 /100 | #260 | Tragic 20.1% |
| Immigrants | Bangladesh | 0.2 /100 | #261 | Tragic 20.1% |
| Liberians | 0.1 /100 | #262 | Tragic 20.2% |