Immigrants from North Macedonia vs Immigrants from Haiti Single Father Poverty
COMPARE
Immigrants from North Macedonia
Immigrants from Haiti
Single Father Poverty
Single Father Poverty Comparison
Immigrants from North Macedonia
Immigrants from Haiti
17.9%
SINGLE FATHER POVERTY
0.0/ 100
METRIC RATING
286th/ 347
METRIC RANK
17.2%
SINGLE FATHER POVERTY
0.8/ 100
METRIC RATING
256th/ 347
METRIC RANK
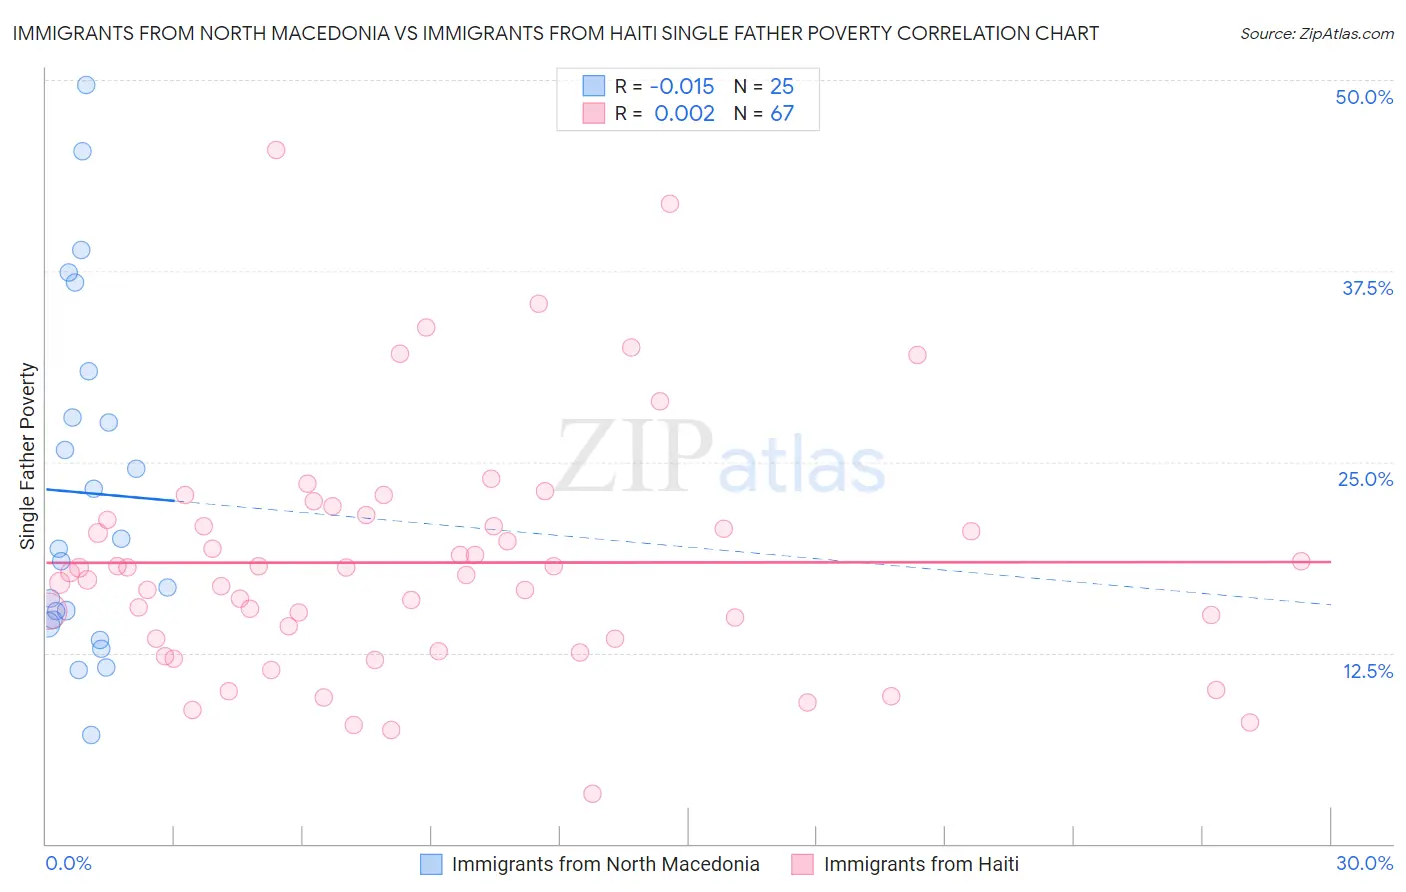
Immigrants from North Macedonia vs Immigrants from Haiti Single Father Poverty Correlation Chart
The statistical analysis conducted on geographies consisting of 65,204,585 people shows no correlation between the proportion of Immigrants from North Macedonia and poverty level among single fathers in the United States with a correlation coefficient (R) of -0.015 and weighted average of 17.9%. Similarly, the statistical analysis conducted on geographies consisting of 189,968,112 people shows no correlation between the proportion of Immigrants from Haiti and poverty level among single fathers in the United States with a correlation coefficient (R) of 0.002 and weighted average of 17.2%, a difference of 4.3%.
Single Father Poverty Correlation Summary
| Measurement | Immigrants from North Macedonia | Immigrants from Haiti |
| Minimum | 7.1% | 3.3% |
| Maximum | 49.6% | 45.4% |
| Range | 42.5% | 42.1% |
| Mean | 23.0% | 18.4% |
| Median | 19.3% | 17.8% |
| Interquartile 25% (IQ1) | 14.5% | 13.4% |
| Interquartile 75% (IQ3) | 29.4% | 21.2% |
| Interquartile Range (IQR) | 14.9% | 7.8% |
| Standard Deviation (Sample) | 11.3% | 7.9% |
| Standard Deviation (Population) | 11.1% | 7.8% |
Similar Demographics by Single Father Poverty
Demographics Similar to Immigrants from North Macedonia by Single Father Poverty
In terms of single father poverty, the demographic groups most similar to Immigrants from North Macedonia are Immigrants from Lebanon (17.9%, a difference of 0.18%), Carpatho Rusyn (18.0%, a difference of 0.22%), Bahamian (18.0%, a difference of 0.25%), Welsh (17.8%, a difference of 0.55%), and Alsatian (17.8%, a difference of 0.56%).
| Demographics | Rating | Rank | Single Father Poverty |
| Iroquois | 0.0 /100 | #279 | Tragic 17.7% |
| Scottish | 0.0 /100 | #280 | Tragic 17.7% |
| English | 0.0 /100 | #281 | Tragic 17.8% |
| Dutch | 0.0 /100 | #282 | Tragic 17.8% |
| Alsatians | 0.0 /100 | #283 | Tragic 17.8% |
| Welsh | 0.0 /100 | #284 | Tragic 17.8% |
| Immigrants | Lebanon | 0.0 /100 | #285 | Tragic 17.9% |
| Immigrants | North Macedonia | 0.0 /100 | #286 | Tragic 17.9% |
| Carpatho Rusyns | 0.0 /100 | #287 | Tragic 18.0% |
| Bahamians | 0.0 /100 | #288 | Tragic 18.0% |
| Irish | 0.0 /100 | #289 | Tragic 18.0% |
| West Indians | 0.0 /100 | #290 | Tragic 18.0% |
| Alaskan Athabascans | 0.0 /100 | #291 | Tragic 18.1% |
| Immigrants | Bahamas | 0.0 /100 | #292 | Tragic 18.1% |
| Alaska Natives | 0.0 /100 | #293 | Tragic 18.1% |
Demographics Similar to Immigrants from Haiti by Single Father Poverty
In terms of single father poverty, the demographic groups most similar to Immigrants from Haiti are Sierra Leonean (17.2%, a difference of 0.010%), Immigrants from Albania (17.2%, a difference of 0.080%), Albanian (17.2%, a difference of 0.10%), Immigrants from Jamaica (17.2%, a difference of 0.13%), and Immigrants from Honduras (17.1%, a difference of 0.19%).
| Demographics | Rating | Rank | Single Father Poverty |
| Canadians | 1.3 /100 | #249 | Tragic 17.1% |
| Austrians | 1.1 /100 | #250 | Tragic 17.1% |
| Luxembourgers | 1.1 /100 | #251 | Tragic 17.1% |
| Croatians | 1.0 /100 | #252 | Tragic 17.1% |
| Cree | 1.0 /100 | #253 | Tragic 17.1% |
| Immigrants | Honduras | 0.9 /100 | #254 | Tragic 17.1% |
| Sierra Leoneans | 0.8 /100 | #255 | Tragic 17.2% |
| Immigrants | Haiti | 0.8 /100 | #256 | Tragic 17.2% |
| Immigrants | Albania | 0.7 /100 | #257 | Tragic 17.2% |
| Albanians | 0.7 /100 | #258 | Tragic 17.2% |
| Immigrants | Jamaica | 0.7 /100 | #259 | Tragic 17.2% |
| Spaniards | 0.6 /100 | #260 | Tragic 17.2% |
| Swiss | 0.5 /100 | #261 | Tragic 17.3% |
| Immigrants | Zaire | 0.4 /100 | #262 | Tragic 17.3% |
| Lithuanians | 0.4 /100 | #263 | Tragic 17.3% |