Immigrants from North America vs Luxembourger Single Male Poverty
COMPARE
Immigrants from North America
Luxembourger
Single Male Poverty
Single Male Poverty Comparison
Immigrants from North America
Luxembourgers
12.9%
SINGLE MALE POVERTY
37.7/ 100
METRIC RATING
180th/ 347
METRIC RANK
13.4%
SINGLE MALE POVERTY
3.6/ 100
METRIC RATING
236th/ 347
METRIC RANK
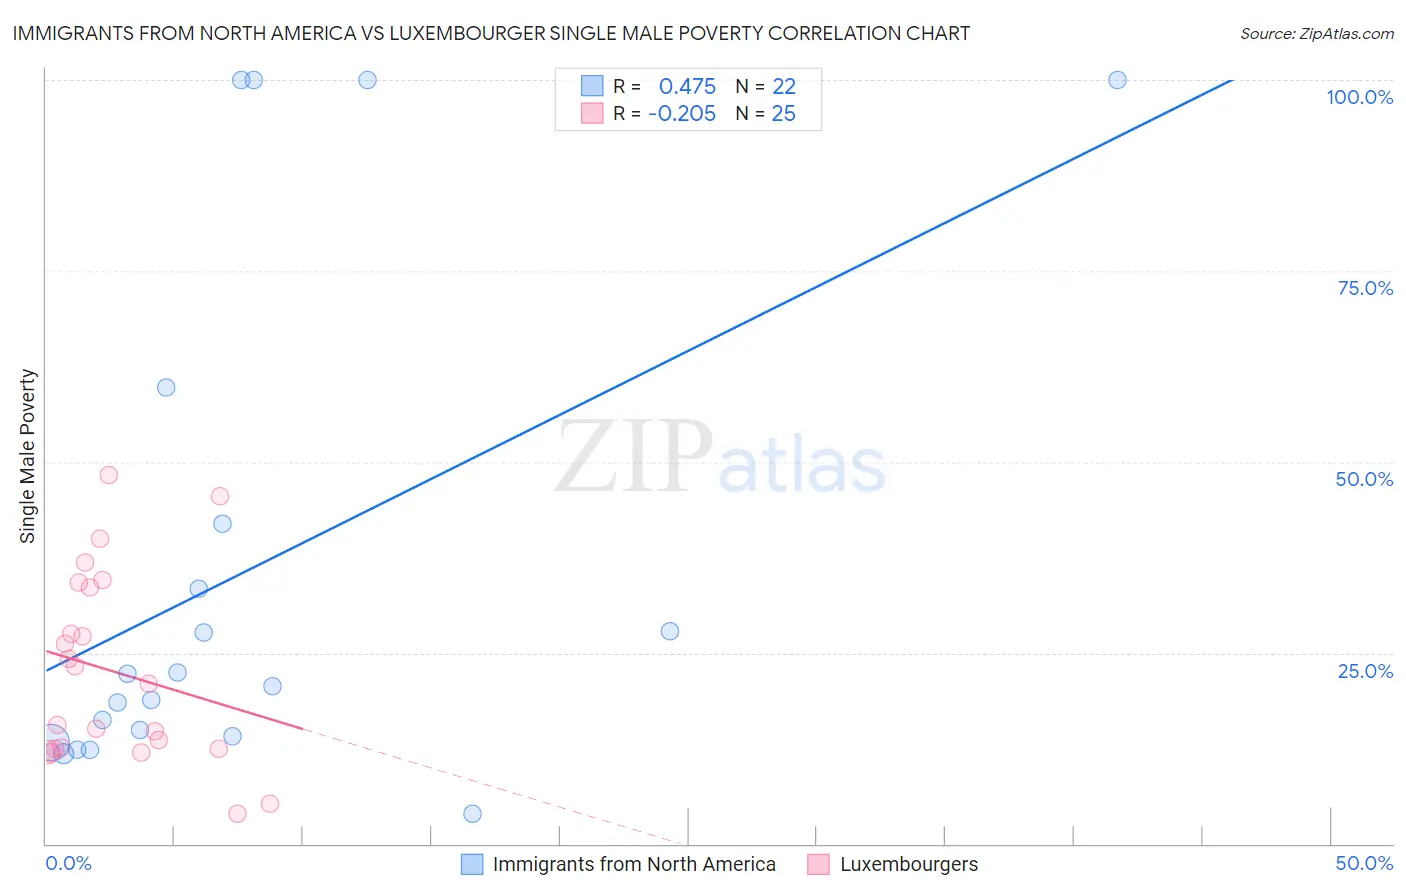
Immigrants from North America vs Luxembourger Single Male Poverty Correlation Chart
The statistical analysis conducted on geographies consisting of 398,248,842 people shows a moderate positive correlation between the proportion of Immigrants from North America and poverty level among single males in the United States with a correlation coefficient (R) of 0.475 and weighted average of 12.9%. Similarly, the statistical analysis conducted on geographies consisting of 133,228,824 people shows a weak negative correlation between the proportion of Luxembourgers and poverty level among single males in the United States with a correlation coefficient (R) of -0.205 and weighted average of 13.4%, a difference of 3.7%.
Single Male Poverty Correlation Summary
| Measurement | Immigrants from North America | Luxembourger |
| Minimum | 4.0% | 4.0% |
| Maximum | 100.0% | 48.3% |
| Range | 96.0% | 44.3% |
| Mean | 36.0% | 22.6% |
| Median | 21.5% | 20.9% |
| Interquartile 25% (IQ1) | 14.1% | 12.5% |
| Interquartile 75% (IQ3) | 41.9% | 33.9% |
| Interquartile Range (IQR) | 27.8% | 21.4% |
| Standard Deviation (Sample) | 33.0% | 12.4% |
| Standard Deviation (Population) | 32.3% | 12.1% |
Similar Demographics by Single Male Poverty
Demographics Similar to Immigrants from North America by Single Male Poverty
In terms of single male poverty, the demographic groups most similar to Immigrants from North America are Panamanian (12.9%, a difference of 0.010%), Moroccan (12.9%, a difference of 0.050%), Israeli (12.9%, a difference of 0.18%), Immigrants from West Indies (12.9%, a difference of 0.27%), and Immigrants from Switzerland (12.8%, a difference of 0.29%).
| Demographics | Rating | Rank | Single Male Poverty |
| Immigrants | St. Vincent and the Grenadines | 50.9 /100 | #173 | Average 12.8% |
| Costa Ricans | 50.0 /100 | #174 | Average 12.8% |
| Croatians | 48.9 /100 | #175 | Average 12.8% |
| Syrians | 48.4 /100 | #176 | Average 12.8% |
| Immigrants | Canada | 44.8 /100 | #177 | Average 12.8% |
| Immigrants | Switzerland | 43.1 /100 | #178 | Average 12.8% |
| Israelis | 41.0 /100 | #179 | Average 12.9% |
| Immigrants | North America | 37.7 /100 | #180 | Fair 12.9% |
| Panamanians | 37.6 /100 | #181 | Fair 12.9% |
| Moroccans | 36.8 /100 | #182 | Fair 12.9% |
| Immigrants | West Indies | 33.0 /100 | #183 | Fair 12.9% |
| Immigrants | Trinidad and Tobago | 32.5 /100 | #184 | Fair 12.9% |
| Norwegians | 32.0 /100 | #185 | Fair 12.9% |
| Nigerians | 31.9 /100 | #186 | Fair 12.9% |
| Immigrants | Kuwait | 31.9 /100 | #187 | Fair 12.9% |
Demographics Similar to Luxembourgers by Single Male Poverty
In terms of single male poverty, the demographic groups most similar to Luxembourgers are Bangladeshi (13.3%, a difference of 0.050%), British West Indian (13.4%, a difference of 0.060%), Canadian (13.3%, a difference of 0.15%), British (13.3%, a difference of 0.16%), and Immigrants from Ghana (13.4%, a difference of 0.16%).
| Demographics | Rating | Rank | Single Male Poverty |
| Europeans | 6.2 /100 | #229 | Tragic 13.3% |
| Ghanaians | 6.1 /100 | #230 | Tragic 13.3% |
| Slavs | 5.3 /100 | #231 | Tragic 13.3% |
| Immigrants | Caribbean | 5.0 /100 | #232 | Tragic 13.3% |
| British | 4.0 /100 | #233 | Tragic 13.3% |
| Canadians | 4.0 /100 | #234 | Tragic 13.3% |
| Bangladeshis | 3.7 /100 | #235 | Tragic 13.3% |
| Luxembourgers | 3.6 /100 | #236 | Tragic 13.4% |
| British West Indians | 3.4 /100 | #237 | Tragic 13.4% |
| Immigrants | Ghana | 3.2 /100 | #238 | Tragic 13.4% |
| Czechoslovakians | 3.0 /100 | #239 | Tragic 13.4% |
| Belizeans | 2.3 /100 | #240 | Tragic 13.4% |
| Immigrants | Germany | 2.1 /100 | #241 | Tragic 13.4% |
| Carpatho Rusyns | 2.1 /100 | #242 | Tragic 13.4% |
| Barbadians | 2.1 /100 | #243 | Tragic 13.4% |