Immigrants from North America vs Guatemalan Receiving Food Stamps
COMPARE
Immigrants from North America
Guatemalan
Receiving Food Stamps
Receiving Food Stamps Comparison
Immigrants from North America
Guatemalans
9.8%
RECEIVING FOOD STAMPS
99.2/ 100
METRIC RATING
64th/ 347
METRIC RANK
14.4%
RECEIVING FOOD STAMPS
0.1/ 100
METRIC RATING
268th/ 347
METRIC RANK
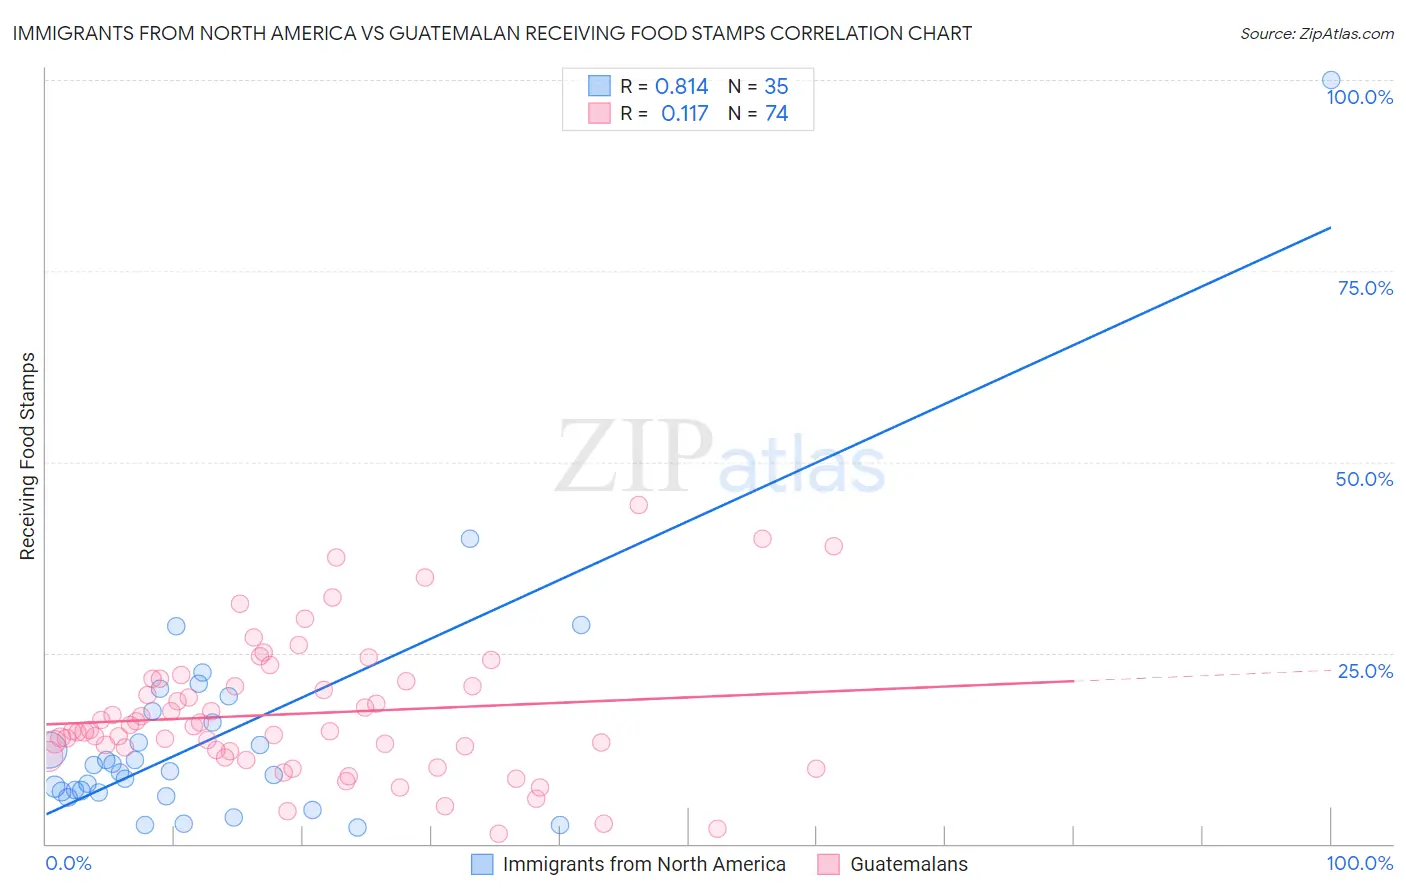
Immigrants from North America vs Guatemalan Receiving Food Stamps Correlation Chart
The statistical analysis conducted on geographies consisting of 460,673,345 people shows a very strong positive correlation between the proportion of Immigrants from North America and percentage of population receiving government assistance and/or food stamps in the United States with a correlation coefficient (R) of 0.814 and weighted average of 9.8%. Similarly, the statistical analysis conducted on geographies consisting of 408,642,708 people shows a poor positive correlation between the proportion of Guatemalans and percentage of population receiving government assistance and/or food stamps in the United States with a correlation coefficient (R) of 0.117 and weighted average of 14.4%, a difference of 47.5%.
Receiving Food Stamps Correlation Summary
| Measurement | Immigrants from North America | Guatemalan |
| Minimum | 2.1% | 1.3% |
| Maximum | 100.0% | 44.4% |
| Range | 97.9% | 43.1% |
| Mean | 14.4% | 17.0% |
| Median | 9.6% | 14.8% |
| Interquartile 25% (IQ1) | 6.7% | 12.2% |
| Interquartile 75% (IQ3) | 17.4% | 21.2% |
| Interquartile Range (IQR) | 10.7% | 9.0% |
| Standard Deviation (Sample) | 17.1% | 8.9% |
| Standard Deviation (Population) | 16.9% | 8.8% |
Similar Demographics by Receiving Food Stamps
Demographics Similar to Immigrants from North America by Receiving Food Stamps
In terms of receiving food stamps, the demographic groups most similar to Immigrants from North America are Chinese (9.8%, a difference of 0.090%), Immigrants from Bulgaria (9.8%, a difference of 0.12%), Immigrants from Turkey (9.8%, a difference of 0.17%), English (9.8%, a difference of 0.19%), and German (9.7%, a difference of 0.34%).
| Demographics | Rating | Rank | Receiving Food Stamps |
| Greeks | 99.3 /100 | #57 | Exceptional 9.7% |
| Scandinavians | 99.2 /100 | #58 | Exceptional 9.7% |
| British | 99.2 /100 | #59 | Exceptional 9.7% |
| Germans | 99.2 /100 | #60 | Exceptional 9.7% |
| English | 99.2 /100 | #61 | Exceptional 9.8% |
| Immigrants | Bulgaria | 99.2 /100 | #62 | Exceptional 9.8% |
| Chinese | 99.2 /100 | #63 | Exceptional 9.8% |
| Immigrants | North America | 99.2 /100 | #64 | Exceptional 9.8% |
| Immigrants | Turkey | 99.1 /100 | #65 | Exceptional 9.8% |
| Slovenes | 99.1 /100 | #66 | Exceptional 9.8% |
| Immigrants | Indonesia | 99.0 /100 | #67 | Exceptional 9.8% |
| Northern Europeans | 99.0 /100 | #68 | Exceptional 9.8% |
| Italians | 99.0 /100 | #69 | Exceptional 9.9% |
| Immigrants | Serbia | 99.0 /100 | #70 | Exceptional 9.9% |
| Scottish | 98.9 /100 | #71 | Exceptional 9.9% |
Demographics Similar to Guatemalans by Receiving Food Stamps
In terms of receiving food stamps, the demographic groups most similar to Guatemalans are Dutch West Indian (14.3%, a difference of 0.66%), Cheyenne (14.3%, a difference of 0.88%), Blackfeet (14.3%, a difference of 0.96%), Immigrants from Uzbekistan (14.3%, a difference of 1.0%), and Paiute (14.3%, a difference of 1.1%).
| Demographics | Rating | Rank | Receiving Food Stamps |
| Immigrants | Congo | 0.3 /100 | #261 | Tragic 14.1% |
| Paiute | 0.2 /100 | #262 | Tragic 14.3% |
| Immigrants | Portugal | 0.2 /100 | #263 | Tragic 14.3% |
| Immigrants | Uzbekistan | 0.2 /100 | #264 | Tragic 14.3% |
| Blackfeet | 0.2 /100 | #265 | Tragic 14.3% |
| Cheyenne | 0.2 /100 | #266 | Tragic 14.3% |
| Dutch West Indians | 0.2 /100 | #267 | Tragic 14.3% |
| Guatemalans | 0.1 /100 | #268 | Tragic 14.4% |
| Nepalese | 0.1 /100 | #269 | Tragic 14.6% |
| Mexicans | 0.1 /100 | #270 | Tragic 14.6% |
| Immigrants | Guatemala | 0.1 /100 | #271 | Tragic 14.6% |
| Chippewa | 0.1 /100 | #272 | Tragic 14.7% |
| Alaskan Athabascans | 0.1 /100 | #273 | Tragic 14.7% |
| Immigrants | Western Africa | 0.1 /100 | #274 | Tragic 14.7% |
| Ute | 0.1 /100 | #275 | Tragic 14.7% |