Immigrants from North America vs Immigrants from Scotland Divorced or Separated
COMPARE
Immigrants from North America
Immigrants from Scotland
Divorced or Separated
Divorced or Separated Comparison
Immigrants from North America
Immigrants from Scotland
12.1%
DIVORCED OR SEPARATED
41.1/ 100
METRIC RATING
184th/ 347
METRIC RANK
12.0%
DIVORCED OR SEPARATED
65.8/ 100
METRIC RATING
160th/ 347
METRIC RANK
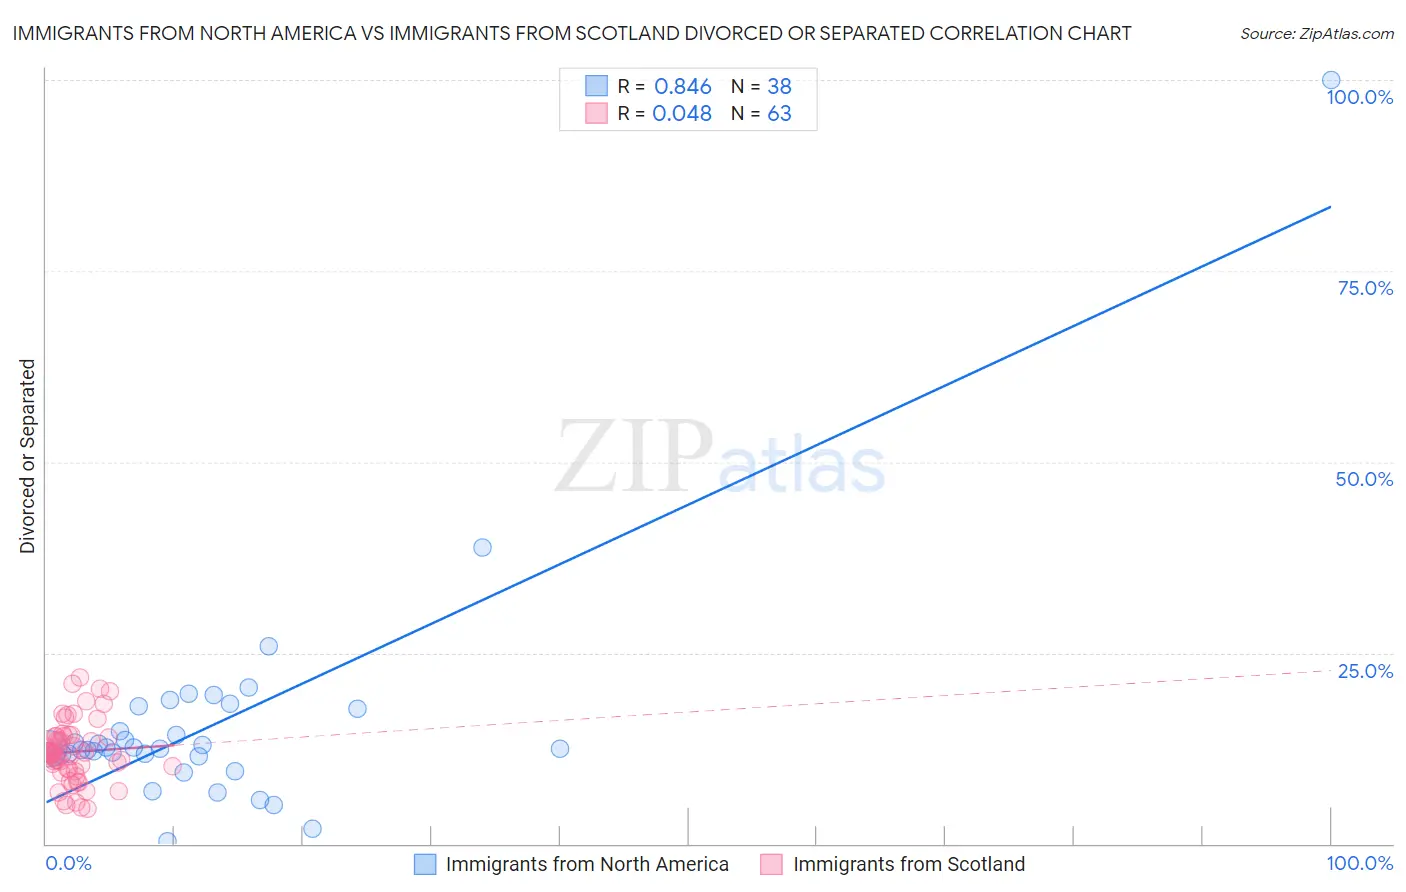
Immigrants from North America vs Immigrants from Scotland Divorced or Separated Correlation Chart
The statistical analysis conducted on geographies consisting of 462,276,849 people shows a very strong positive correlation between the proportion of Immigrants from North America and percentage of population currently divorced or separated in the United States with a correlation coefficient (R) of 0.846 and weighted average of 12.1%. Similarly, the statistical analysis conducted on geographies consisting of 196,385,271 people shows no correlation between the proportion of Immigrants from Scotland and percentage of population currently divorced or separated in the United States with a correlation coefficient (R) of 0.048 and weighted average of 12.0%, a difference of 0.88%.
Divorced or Separated Correlation Summary
| Measurement | Immigrants from North America | Immigrants from Scotland |
| Minimum | 0.33% | 4.6% |
| Maximum | 100.0% | 21.8% |
| Range | 99.7% | 17.2% |
| Mean | 15.6% | 12.0% |
| Median | 12.5% | 11.9% |
| Interquartile 25% (IQ1) | 11.6% | 9.8% |
| Interquartile 75% (IQ3) | 17.6% | 14.1% |
| Interquartile Range (IQR) | 6.0% | 4.2% |
| Standard Deviation (Sample) | 15.5% | 4.0% |
| Standard Deviation (Population) | 15.3% | 4.0% |
Similar Demographics by Divorced or Separated
Demographics Similar to Immigrants from North America by Divorced or Separated
In terms of divorced or separated, the demographic groups most similar to Immigrants from North America are Immigrants from Nigeria (12.1%, a difference of 0.020%), Immigrants from Central America (12.1%, a difference of 0.060%), Immigrants from Ethiopia (12.1%, a difference of 0.070%), Immigrants from Chile (12.1%, a difference of 0.070%), and Immigrants from Canada (12.1%, a difference of 0.10%).
| Demographics | Rating | Rank | Divorced or Separated |
| Brazilians | 47.7 /100 | #177 | Average 12.1% |
| Ghanaians | 45.9 /100 | #178 | Average 12.1% |
| Immigrants | Western Europe | 45.6 /100 | #179 | Average 12.1% |
| Barbadians | 45.0 /100 | #180 | Average 12.1% |
| Immigrants | Canada | 44.0 /100 | #181 | Average 12.1% |
| Immigrants | Ethiopia | 43.1 /100 | #182 | Average 12.1% |
| Immigrants | Central America | 42.9 /100 | #183 | Average 12.1% |
| Immigrants | North America | 41.1 /100 | #184 | Average 12.1% |
| Immigrants | Nigeria | 40.5 /100 | #185 | Average 12.1% |
| Immigrants | Chile | 39.0 /100 | #186 | Fair 12.1% |
| Belizeans | 37.7 /100 | #187 | Fair 12.1% |
| Immigrants | Belize | 37.6 /100 | #188 | Fair 12.1% |
| Sierra Leoneans | 35.5 /100 | #189 | Fair 12.1% |
| Moroccans | 34.8 /100 | #190 | Fair 12.1% |
| Swedes | 34.4 /100 | #191 | Fair 12.1% |
Demographics Similar to Immigrants from Scotland by Divorced or Separated
In terms of divorced or separated, the demographic groups most similar to Immigrants from Scotland are Icelander (12.0%, a difference of 0.010%), Immigrants from Barbados (12.0%, a difference of 0.010%), Marshallese (12.0%, a difference of 0.040%), Samoan (12.0%, a difference of 0.060%), and Navajo (12.0%, a difference of 0.070%).
| Demographics | Rating | Rank | Divorced or Separated |
| Austrians | 72.2 /100 | #153 | Good 12.0% |
| Chileans | 71.3 /100 | #154 | Good 12.0% |
| Japanese | 70.9 /100 | #155 | Good 12.0% |
| Hungarians | 70.3 /100 | #156 | Good 12.0% |
| Immigrants | Brazil | 68.8 /100 | #157 | Good 12.0% |
| Icelanders | 66.0 /100 | #158 | Good 12.0% |
| Immigrants | Barbados | 66.0 /100 | #159 | Good 12.0% |
| Immigrants | Scotland | 65.8 /100 | #160 | Good 12.0% |
| Marshallese | 64.6 /100 | #161 | Good 12.0% |
| Samoans | 64.3 /100 | #162 | Good 12.0% |
| Navajo | 63.9 /100 | #163 | Good 12.0% |
| Swiss | 63.6 /100 | #164 | Good 12.0% |
| German Russians | 61.8 /100 | #165 | Good 12.0% |
| Tohono O'odham | 60.4 /100 | #166 | Good 12.0% |
| Ethiopians | 58.5 /100 | #167 | Average 12.0% |