Immigrants from Bolivia vs Delaware Single Female Poverty
COMPARE
Immigrants from Bolivia
Delaware
Single Female Poverty
Single Female Poverty Comparison
Immigrants from Bolivia
Delaware
17.8%
SINGLE FEMALE POVERTY
100.0/ 100
METRIC RATING
13th/ 347
METRIC RANK
22.5%
SINGLE FEMALE POVERTY
1.0/ 100
METRIC RATING
252nd/ 347
METRIC RANK
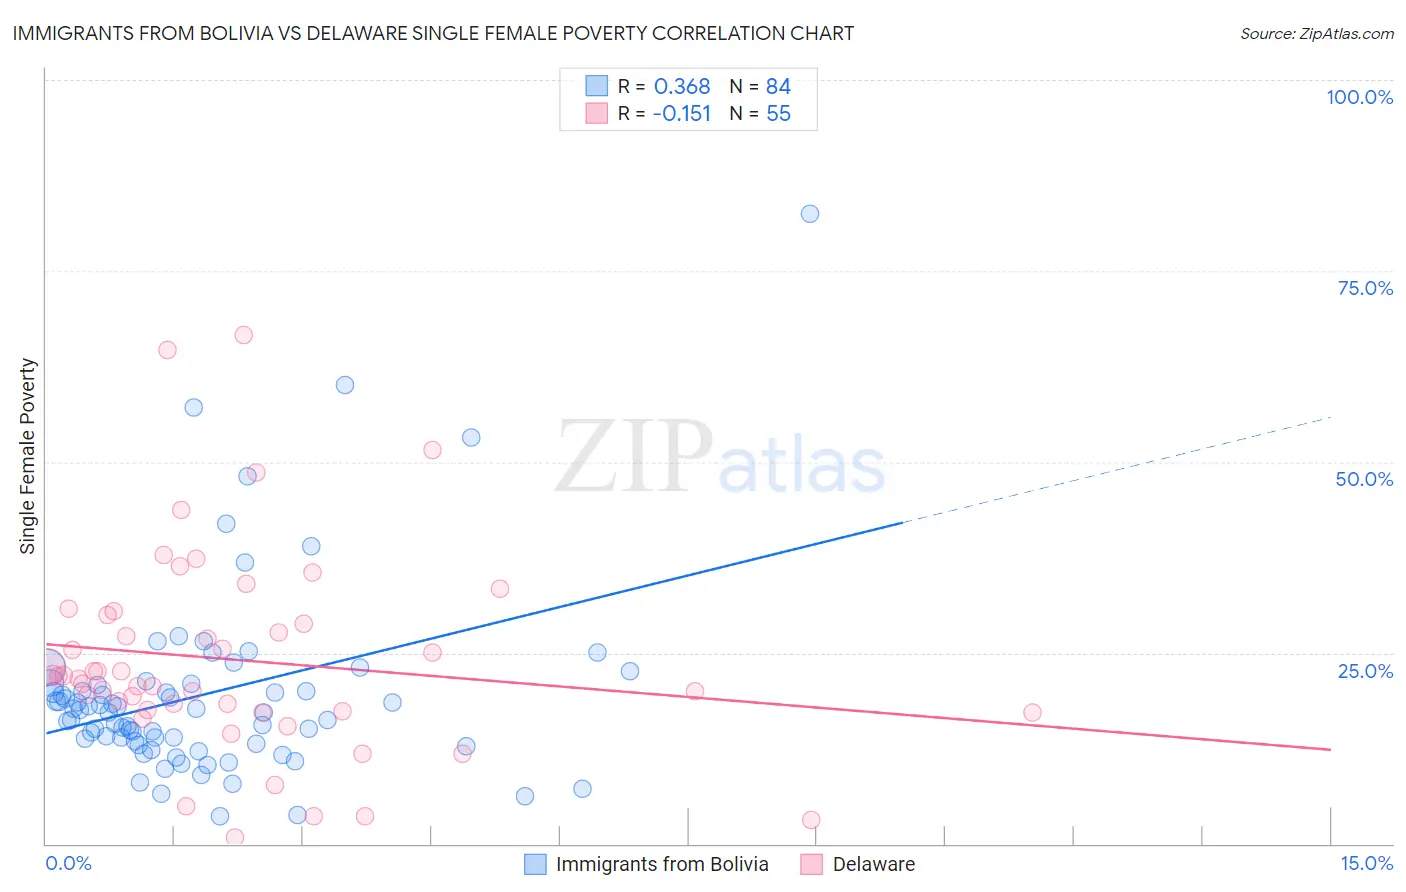
Immigrants from Bolivia vs Delaware Single Female Poverty Correlation Chart
The statistical analysis conducted on geographies consisting of 157,883,444 people shows a mild positive correlation between the proportion of Immigrants from Bolivia and poverty level among single females in the United States with a correlation coefficient (R) of 0.368 and weighted average of 17.8%. Similarly, the statistical analysis conducted on geographies consisting of 95,602,651 people shows a poor negative correlation between the proportion of Delaware and poverty level among single females in the United States with a correlation coefficient (R) of -0.151 and weighted average of 22.5%, a difference of 26.2%.
Single Female Poverty Correlation Summary
| Measurement | Immigrants from Bolivia | Delaware |
| Minimum | 3.6% | 0.74% |
| Maximum | 82.5% | 66.7% |
| Range | 78.9% | 65.9% |
| Mean | 19.6% | 24.1% |
| Median | 17.3% | 22.0% |
| Interquartile 25% (IQ1) | 13.3% | 17.3% |
| Interquartile 75% (IQ3) | 20.9% | 30.0% |
| Interquartile Range (IQR) | 7.6% | 12.6% |
| Standard Deviation (Sample) | 12.6% | 13.4% |
| Standard Deviation (Population) | 12.5% | 13.2% |
Similar Demographics by Single Female Poverty
Demographics Similar to Immigrants from Bolivia by Single Female Poverty
In terms of single female poverty, the demographic groups most similar to Immigrants from Bolivia are Immigrants from South Central Asia (17.8%, a difference of 0.26%), Immigrants from Lithuania (17.8%, a difference of 0.32%), Immigrants from Ireland (17.8%, a difference of 0.41%), Bolivian (17.9%, a difference of 0.44%), and Indian (Asian) (17.9%, a difference of 0.59%).
| Demographics | Rating | Rank | Single Female Poverty |
| Filipinos | 100.0 /100 | #6 | Exceptional 17.0% |
| Thais | 100.0 /100 | #7 | Exceptional 17.3% |
| Immigrants | Iran | 100.0 /100 | #8 | Exceptional 17.5% |
| Bhutanese | 100.0 /100 | #9 | Exceptional 17.7% |
| Immigrants | Ireland | 100.0 /100 | #10 | Exceptional 17.8% |
| Immigrants | Lithuania | 100.0 /100 | #11 | Exceptional 17.8% |
| Immigrants | South Central Asia | 100.0 /100 | #12 | Exceptional 17.8% |
| Immigrants | Bolivia | 100.0 /100 | #13 | Exceptional 17.8% |
| Bolivians | 100.0 /100 | #14 | Exceptional 17.9% |
| Indians (Asian) | 100.0 /100 | #15 | Exceptional 17.9% |
| Iranians | 100.0 /100 | #16 | Exceptional 18.0% |
| Immigrants | Korea | 100.0 /100 | #17 | Exceptional 18.1% |
| Immigrants | Eastern Asia | 100.0 /100 | #18 | Exceptional 18.1% |
| Immigrants | China | 100.0 /100 | #19 | Exceptional 18.1% |
| Immigrants | Greece | 100.0 /100 | #20 | Exceptional 18.3% |
Demographics Similar to Delaware by Single Female Poverty
In terms of single female poverty, the demographic groups most similar to Delaware are Immigrants from Liberia (22.5%, a difference of 0.090%), Immigrants from West Indies (22.5%, a difference of 0.11%), Immigrants from Burma/Myanmar (22.6%, a difference of 0.19%), Immigrants from Sudan (22.6%, a difference of 0.19%), and Immigrants from Bahamas (22.5%, a difference of 0.26%).
| Demographics | Rating | Rank | Single Female Poverty |
| Immigrants | Bangladesh | 1.8 /100 | #245 | Tragic 22.3% |
| Liberians | 1.4 /100 | #246 | Tragic 22.4% |
| Immigrants | El Salvador | 1.4 /100 | #247 | Tragic 22.4% |
| Belizeans | 1.4 /100 | #248 | Tragic 22.4% |
| Immigrants | Caribbean | 1.3 /100 | #249 | Tragic 22.4% |
| Immigrants | Bahamas | 1.2 /100 | #250 | Tragic 22.5% |
| Immigrants | West Indies | 1.0 /100 | #251 | Tragic 22.5% |
| Delaware | 1.0 /100 | #252 | Tragic 22.5% |
| Immigrants | Liberia | 0.9 /100 | #253 | Tragic 22.5% |
| Immigrants | Burma/Myanmar | 0.8 /100 | #254 | Tragic 22.6% |
| Immigrants | Sudan | 0.8 /100 | #255 | Tragic 22.6% |
| Immigrants | Belize | 0.8 /100 | #256 | Tragic 22.6% |
| Sudanese | 0.7 /100 | #257 | Tragic 22.6% |
| Bahamians | 0.6 /100 | #258 | Tragic 22.7% |
| Whites/Caucasians | 0.6 /100 | #259 | Tragic 22.7% |