Immigrants from North America vs Bangladeshi Child Poverty Under the Age of 16
COMPARE
Immigrants from North America
Bangladeshi
Child Poverty Under the Age of 16
Child Poverty Under the Age of 16 Comparison
Immigrants from North America
Bangladeshis
14.6%
CHILD POVERTY UNDER THE AGE OF 16
96.7/ 100
METRIC RATING
91st/ 347
METRIC RANK
19.9%
CHILD POVERTY UNDER THE AGE OF 16
0.0/ 100
METRIC RATING
278th/ 347
METRIC RANK
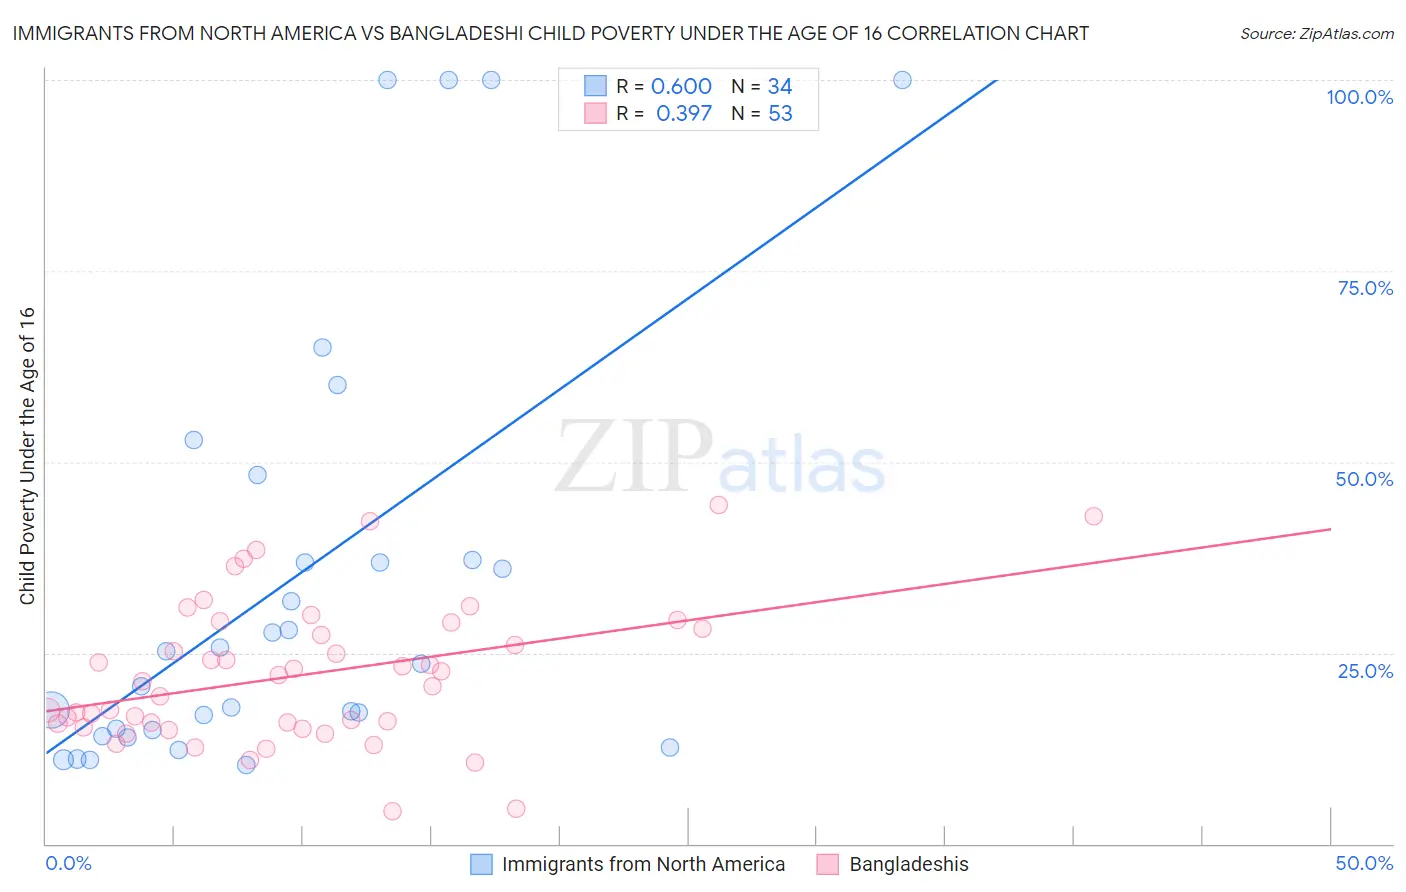
Immigrants from North America vs Bangladeshi Child Poverty Under the Age of 16 Correlation Chart
The statistical analysis conducted on geographies consisting of 455,942,251 people shows a substantial positive correlation between the proportion of Immigrants from North America and poverty level among children under the age of 16 in the United States with a correlation coefficient (R) of 0.600 and weighted average of 14.6%. Similarly, the statistical analysis conducted on geographies consisting of 140,973,938 people shows a mild positive correlation between the proportion of Bangladeshis and poverty level among children under the age of 16 in the United States with a correlation coefficient (R) of 0.397 and weighted average of 19.9%, a difference of 36.7%.
Child Poverty Under the Age of 16 Correlation Summary
| Measurement | Immigrants from North America | Bangladeshi |
| Minimum | 10.3% | 4.3% |
| Maximum | 100.0% | 44.4% |
| Range | 89.7% | 40.0% |
| Mean | 34.4% | 22.1% |
| Median | 24.4% | 21.2% |
| Interquartile 25% (IQ1) | 14.9% | 15.5% |
| Interquartile 75% (IQ3) | 37.1% | 28.6% |
| Interquartile Range (IQR) | 22.2% | 13.0% |
| Standard Deviation (Sample) | 28.2% | 9.2% |
| Standard Deviation (Population) | 27.7% | 9.2% |
Similar Demographics by Child Poverty Under the Age of 16
Demographics Similar to Immigrants from North America by Child Poverty Under the Age of 16
In terms of child poverty under the age of 16, the demographic groups most similar to Immigrants from North America are Immigrants from Italy (14.6%, a difference of 0.030%), Argentinean (14.6%, a difference of 0.12%), Austrian (14.5%, a difference of 0.18%), German (14.5%, a difference of 0.25%), and Northern European (14.5%, a difference of 0.30%).
| Demographics | Rating | Rank | Child Poverty Under the Age of 16 |
| Immigrants | Latvia | 97.1 /100 | #84 | Exceptional 14.5% |
| Soviet Union | 97.1 /100 | #85 | Exceptional 14.5% |
| Immigrants | Argentina | 97.1 /100 | #86 | Exceptional 14.5% |
| Taiwanese | 97.1 /100 | #87 | Exceptional 14.5% |
| Northern Europeans | 97.0 /100 | #88 | Exceptional 14.5% |
| Germans | 96.9 /100 | #89 | Exceptional 14.5% |
| Austrians | 96.9 /100 | #90 | Exceptional 14.5% |
| Immigrants | North America | 96.7 /100 | #91 | Exceptional 14.6% |
| Immigrants | Italy | 96.7 /100 | #92 | Exceptional 14.6% |
| Argentineans | 96.6 /100 | #93 | Exceptional 14.6% |
| Immigrants | South Africa | 96.3 /100 | #94 | Exceptional 14.6% |
| Immigrants | Croatia | 96.1 /100 | #95 | Exceptional 14.6% |
| Immigrants | France | 95.8 /100 | #96 | Exceptional 14.7% |
| Paraguayans | 95.7 /100 | #97 | Exceptional 14.7% |
| Immigrants | Belarus | 95.7 /100 | #98 | Exceptional 14.7% |
Demographics Similar to Bangladeshis by Child Poverty Under the Age of 16
In terms of child poverty under the age of 16, the demographic groups most similar to Bangladeshis are Subsaharan African (19.9%, a difference of 0.010%), Comanche (19.9%, a difference of 0.010%), Iroquois (19.9%, a difference of 0.10%), Immigrants from Cabo Verde (19.9%, a difference of 0.24%), and Immigrants from Barbados (19.9%, a difference of 0.24%).
| Demographics | Rating | Rank | Child Poverty Under the Age of 16 |
| Immigrants | Liberia | 0.1 /100 | #271 | Tragic 19.7% |
| Immigrants | Bangladesh | 0.1 /100 | #272 | Tragic 19.8% |
| Immigrants | Jamaica | 0.1 /100 | #273 | Tragic 19.8% |
| Immigrants | Cabo Verde | 0.1 /100 | #274 | Tragic 19.9% |
| Immigrants | Barbados | 0.1 /100 | #275 | Tragic 19.9% |
| Belizeans | 0.1 /100 | #276 | Tragic 19.9% |
| Iroquois | 0.1 /100 | #277 | Tragic 19.9% |
| Bangladeshis | 0.0 /100 | #278 | Tragic 19.9% |
| Sub-Saharan Africans | 0.0 /100 | #279 | Tragic 19.9% |
| Comanche | 0.0 /100 | #280 | Tragic 19.9% |
| Central Americans | 0.0 /100 | #281 | Tragic 20.0% |
| Barbadians | 0.0 /100 | #282 | Tragic 20.0% |
| Immigrants | Zaire | 0.0 /100 | #283 | Tragic 20.1% |
| West Indians | 0.0 /100 | #284 | Tragic 20.1% |
| Immigrants | St. Vincent and the Grenadines | 0.0 /100 | #285 | Tragic 20.1% |