Immigrants from Netherlands vs New Zealander Child Poverty Under the Age of 5
COMPARE
Immigrants from Netherlands
New Zealander
Child Poverty Under the Age of 5
Child Poverty Under the Age of 5 Comparison
Immigrants from Netherlands
New Zealanders
15.6%
CHILD POVERTY UNDER THE AGE OF 5
97.6/ 100
METRIC RATING
84th/ 347
METRIC RANK
16.6%
CHILD POVERTY UNDER THE AGE OF 5
78.7/ 100
METRIC RATING
149th/ 347
METRIC RANK
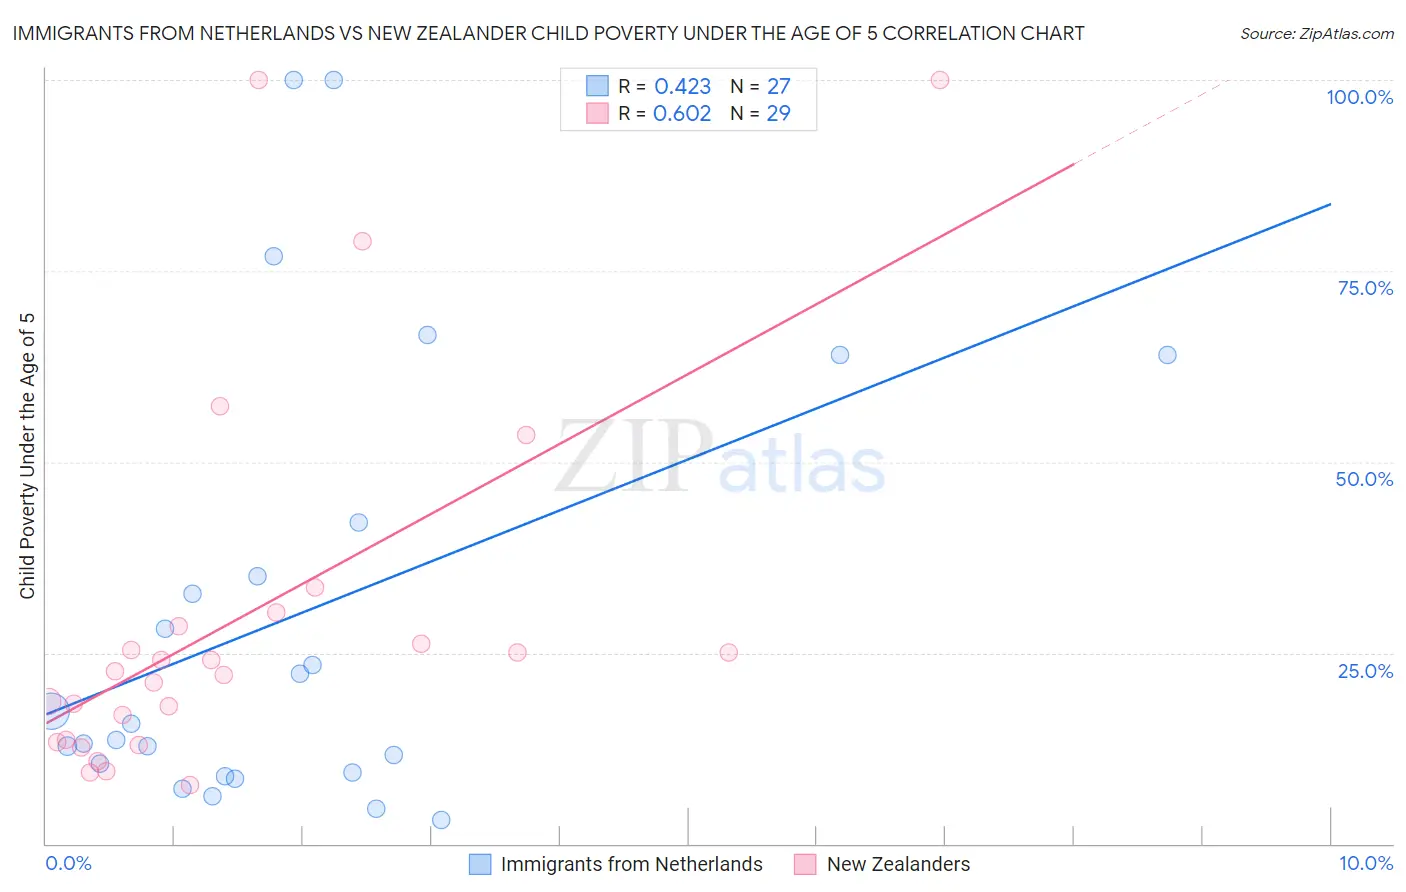
Immigrants from Netherlands vs New Zealander Child Poverty Under the Age of 5 Correlation Chart
The statistical analysis conducted on geographies consisting of 229,684,544 people shows a moderate positive correlation between the proportion of Immigrants from Netherlands and poverty level among children under the age of 5 in the United States with a correlation coefficient (R) of 0.423 and weighted average of 15.6%. Similarly, the statistical analysis conducted on geographies consisting of 105,110,769 people shows a significant positive correlation between the proportion of New Zealanders and poverty level among children under the age of 5 in the United States with a correlation coefficient (R) of 0.602 and weighted average of 16.6%, a difference of 6.9%.
Child Poverty Under the Age of 5 Correlation Summary
| Measurement | Immigrants from Netherlands | New Zealander |
| Minimum | 3.0% | 7.7% |
| Maximum | 100.0% | 100.0% |
| Range | 97.0% | 92.3% |
| Mean | 30.0% | 29.6% |
| Median | 15.7% | 22.7% |
| Interquartile 25% (IQ1) | 9.3% | 13.4% |
| Interquartile 75% (IQ3) | 42.1% | 29.4% |
| Interquartile Range (IQR) | 32.8% | 16.0% |
| Standard Deviation (Sample) | 29.1% | 24.8% |
| Standard Deviation (Population) | 28.5% | 24.4% |
Similar Demographics by Child Poverty Under the Age of 5
Demographics Similar to Immigrants from Netherlands by Child Poverty Under the Age of 5
In terms of child poverty under the age of 5, the demographic groups most similar to Immigrants from Netherlands are Chilean (15.6%, a difference of 0.020%), Immigrants from Latvia (15.6%, a difference of 0.16%), Immigrants from Malaysia (15.6%, a difference of 0.16%), Immigrants from Italy (15.6%, a difference of 0.18%), and Immigrants from Vietnam (15.6%, a difference of 0.24%).
| Demographics | Rating | Rank | Child Poverty Under the Age of 5 |
| Immigrants | Turkey | 98.3 /100 | #77 | Exceptional 15.4% |
| Sri Lankans | 98.1 /100 | #78 | Exceptional 15.5% |
| Australians | 98.0 /100 | #79 | Exceptional 15.5% |
| Italians | 97.9 /100 | #80 | Exceptional 15.5% |
| Czechs | 97.8 /100 | #81 | Exceptional 15.5% |
| Immigrants | Italy | 97.7 /100 | #82 | Exceptional 15.6% |
| Chileans | 97.6 /100 | #83 | Exceptional 15.6% |
| Immigrants | Netherlands | 97.6 /100 | #84 | Exceptional 15.6% |
| Immigrants | Latvia | 97.4 /100 | #85 | Exceptional 15.6% |
| Immigrants | Malaysia | 97.4 /100 | #86 | Exceptional 15.6% |
| Immigrants | Vietnam | 97.4 /100 | #87 | Exceptional 15.6% |
| Jordanians | 97.3 /100 | #88 | Exceptional 15.6% |
| Immigrants | Croatia | 97.3 /100 | #89 | Exceptional 15.6% |
| Immigrants | France | 97.3 /100 | #90 | Exceptional 15.6% |
| Poles | 97.2 /100 | #91 | Exceptional 15.7% |
Demographics Similar to New Zealanders by Child Poverty Under the Age of 5
In terms of child poverty under the age of 5, the demographic groups most similar to New Zealanders are Syrian (16.6%, a difference of 0.060%), Colombian (16.7%, a difference of 0.14%), Canadian (16.7%, a difference of 0.17%), Belgian (16.7%, a difference of 0.24%), and Immigrants from Nepal (16.6%, a difference of 0.25%).
| Demographics | Rating | Rank | Child Poverty Under the Age of 5 |
| Portuguese | 83.0 /100 | #142 | Excellent 16.5% |
| Samoans | 83.0 /100 | #143 | Excellent 16.5% |
| Ethiopians | 82.7 /100 | #144 | Excellent 16.5% |
| Immigrants | Ethiopia | 82.1 /100 | #145 | Excellent 16.6% |
| Israelis | 82.0 /100 | #146 | Excellent 16.6% |
| Immigrants | Nepal | 80.3 /100 | #147 | Excellent 16.6% |
| Syrians | 79.1 /100 | #148 | Good 16.6% |
| New Zealanders | 78.7 /100 | #149 | Good 16.6% |
| Colombians | 77.8 /100 | #150 | Good 16.7% |
| Canadians | 77.6 /100 | #151 | Good 16.7% |
| Belgians | 77.2 /100 | #152 | Good 16.7% |
| Dutch | 77.1 /100 | #153 | Good 16.7% |
| Immigrants | Venezuela | 76.0 /100 | #154 | Good 16.7% |
| South Americans | 75.1 /100 | #155 | Good 16.7% |
| Afghans | 74.4 /100 | #156 | Good 16.8% |