Immigrants from Switzerland vs New Zealander Child Poverty Under the Age of 5
COMPARE
Immigrants from Switzerland
New Zealander
Child Poverty Under the Age of 5
Child Poverty Under the Age of 5 Comparison
Immigrants from Switzerland
New Zealanders
15.8%
CHILD POVERTY UNDER THE AGE OF 5
96.4/ 100
METRIC RATING
95th/ 347
METRIC RANK
16.6%
CHILD POVERTY UNDER THE AGE OF 5
78.7/ 100
METRIC RATING
149th/ 347
METRIC RANK
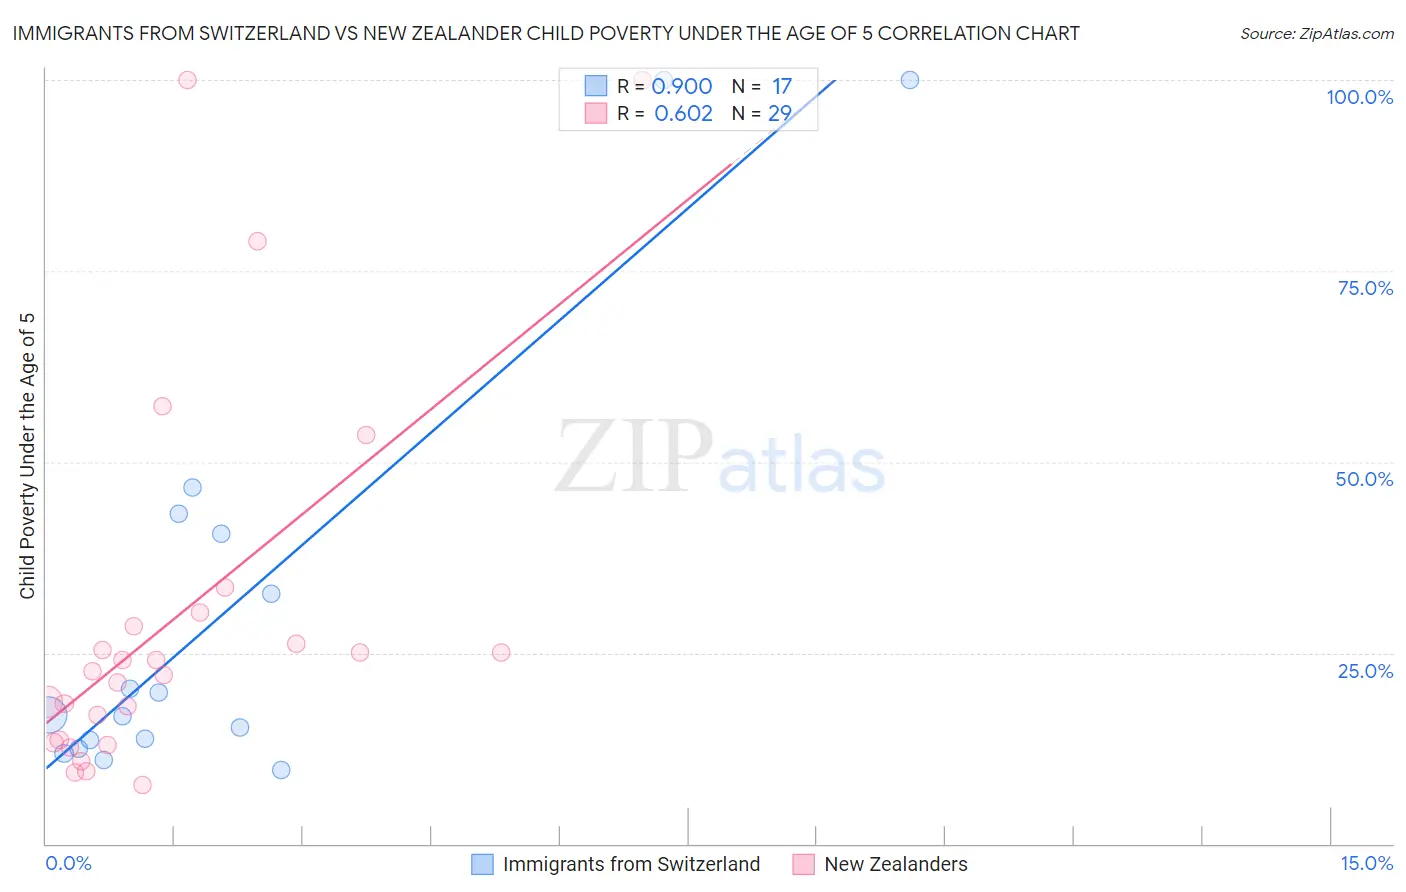
Immigrants from Switzerland vs New Zealander Child Poverty Under the Age of 5 Correlation Chart
The statistical analysis conducted on geographies consisting of 143,009,400 people shows a near-perfect positive correlation between the proportion of Immigrants from Switzerland and poverty level among children under the age of 5 in the United States with a correlation coefficient (R) of 0.900 and weighted average of 15.8%. Similarly, the statistical analysis conducted on geographies consisting of 105,110,769 people shows a significant positive correlation between the proportion of New Zealanders and poverty level among children under the age of 5 in the United States with a correlation coefficient (R) of 0.602 and weighted average of 16.6%, a difference of 5.6%.
Child Poverty Under the Age of 5 Correlation Summary
| Measurement | Immigrants from Switzerland | New Zealander |
| Minimum | 9.7% | 7.7% |
| Maximum | 100.0% | 100.0% |
| Range | 90.3% | 92.3% |
| Mean | 30.8% | 29.6% |
| Median | 16.8% | 22.7% |
| Interquartile 25% (IQ1) | 13.0% | 13.4% |
| Interquartile 75% (IQ3) | 41.9% | 29.4% |
| Interquartile Range (IQR) | 28.9% | 16.0% |
| Standard Deviation (Sample) | 28.6% | 24.8% |
| Standard Deviation (Population) | 27.7% | 24.4% |
Similar Demographics by Child Poverty Under the Age of 5
Demographics Similar to Immigrants from Switzerland by Child Poverty Under the Age of 5
In terms of child poverty under the age of 5, the demographic groups most similar to Immigrants from Switzerland are Immigrants from Kazakhstan (15.8%, a difference of 0.13%), Macedonian (15.8%, a difference of 0.17%), Immigrants from South Africa (15.8%, a difference of 0.24%), Palestinian (15.8%, a difference of 0.35%), and Immigrants from Canada (15.8%, a difference of 0.36%).
| Demographics | Rating | Rank | Child Poverty Under the Age of 5 |
| Jordanians | 97.3 /100 | #88 | Exceptional 15.6% |
| Immigrants | Croatia | 97.3 /100 | #89 | Exceptional 15.6% |
| Immigrants | France | 97.3 /100 | #90 | Exceptional 15.6% |
| Poles | 97.2 /100 | #91 | Exceptional 15.7% |
| Scandinavians | 97.1 /100 | #92 | Exceptional 15.7% |
| Ukrainians | 97.1 /100 | #93 | Exceptional 15.7% |
| Immigrants | South Eastern Asia | 97.1 /100 | #94 | Exceptional 15.7% |
| Immigrants | Switzerland | 96.4 /100 | #95 | Exceptional 15.8% |
| Immigrants | Kazakhstan | 96.2 /100 | #96 | Exceptional 15.8% |
| Macedonians | 96.2 /100 | #97 | Exceptional 15.8% |
| Immigrants | South Africa | 96.1 /100 | #98 | Exceptional 15.8% |
| Palestinians | 95.9 /100 | #99 | Exceptional 15.8% |
| Immigrants | Canada | 95.9 /100 | #100 | Exceptional 15.8% |
| Immigrants | Zimbabwe | 95.9 /100 | #101 | Exceptional 15.8% |
| Armenians | 95.7 /100 | #102 | Exceptional 15.8% |
Demographics Similar to New Zealanders by Child Poverty Under the Age of 5
In terms of child poverty under the age of 5, the demographic groups most similar to New Zealanders are Syrian (16.6%, a difference of 0.060%), Colombian (16.7%, a difference of 0.14%), Canadian (16.7%, a difference of 0.17%), Belgian (16.7%, a difference of 0.24%), and Immigrants from Nepal (16.6%, a difference of 0.25%).
| Demographics | Rating | Rank | Child Poverty Under the Age of 5 |
| Portuguese | 83.0 /100 | #142 | Excellent 16.5% |
| Samoans | 83.0 /100 | #143 | Excellent 16.5% |
| Ethiopians | 82.7 /100 | #144 | Excellent 16.5% |
| Immigrants | Ethiopia | 82.1 /100 | #145 | Excellent 16.6% |
| Israelis | 82.0 /100 | #146 | Excellent 16.6% |
| Immigrants | Nepal | 80.3 /100 | #147 | Excellent 16.6% |
| Syrians | 79.1 /100 | #148 | Good 16.6% |
| New Zealanders | 78.7 /100 | #149 | Good 16.6% |
| Colombians | 77.8 /100 | #150 | Good 16.7% |
| Canadians | 77.6 /100 | #151 | Good 16.7% |
| Belgians | 77.2 /100 | #152 | Good 16.7% |
| Dutch | 77.1 /100 | #153 | Good 16.7% |
| Immigrants | Venezuela | 76.0 /100 | #154 | Good 16.7% |
| South Americans | 75.1 /100 | #155 | Good 16.7% |
| Afghans | 74.4 /100 | #156 | Good 16.8% |