Immigrants from Netherlands vs New Zealander Median Earnings
COMPARE
Immigrants from Netherlands
New Zealander
Median Earnings
Median Earnings Comparison
Immigrants from Netherlands
New Zealanders
$50,818
MEDIAN EARNINGS
99.8/ 100
METRIC RATING
73rd/ 347
METRIC RANK
$51,246
MEDIAN EARNINGS
99.9/ 100
METRIC RATING
64th/ 347
METRIC RANK
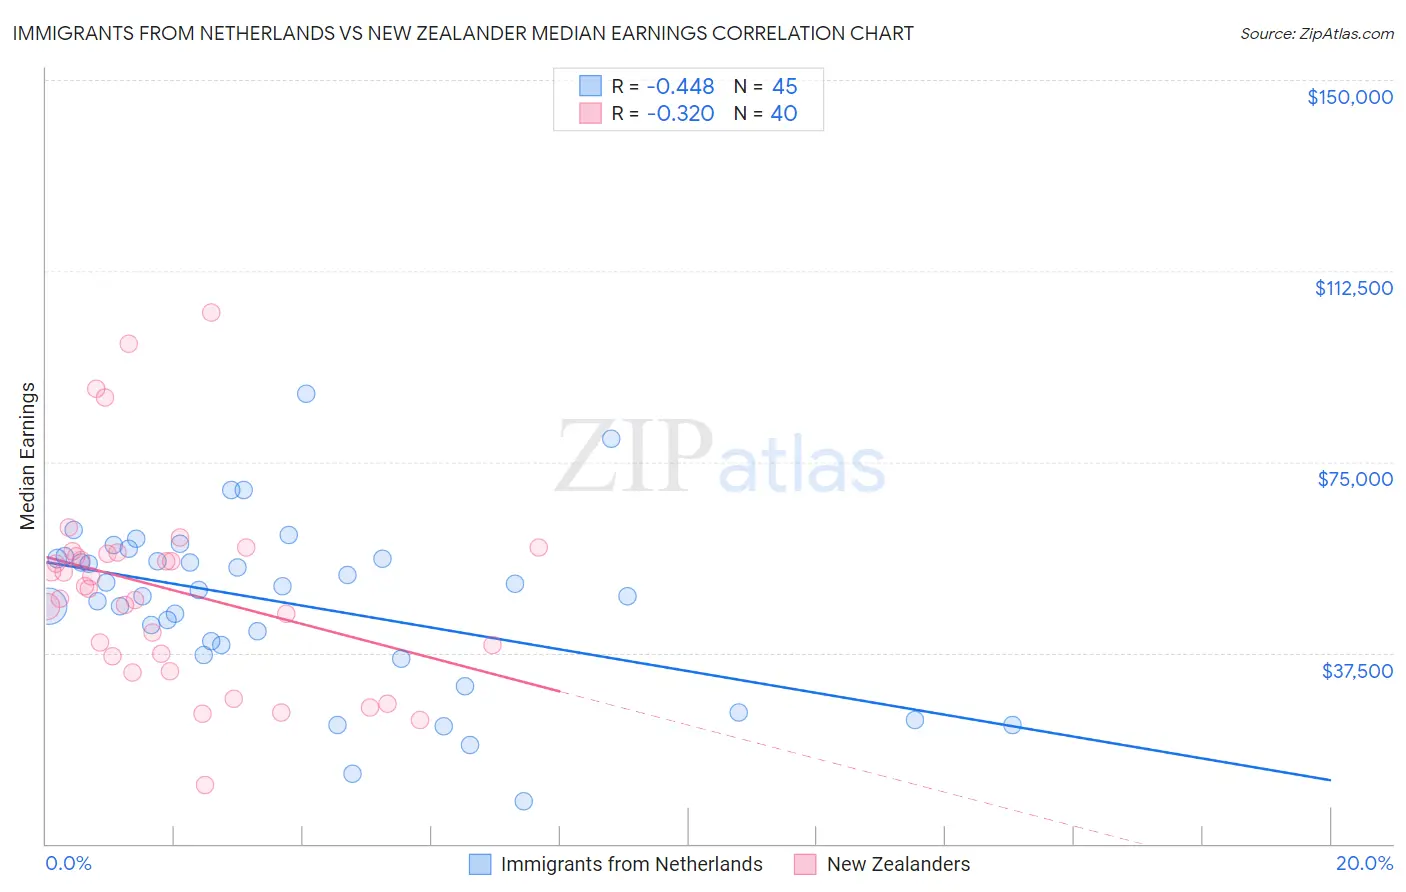
Immigrants from Netherlands vs New Zealander Median Earnings Correlation Chart
The statistical analysis conducted on geographies consisting of 237,873,103 people shows a moderate negative correlation between the proportion of Immigrants from Netherlands and median earnings in the United States with a correlation coefficient (R) of -0.448 and weighted average of $50,818. Similarly, the statistical analysis conducted on geographies consisting of 106,916,811 people shows a mild negative correlation between the proportion of New Zealanders and median earnings in the United States with a correlation coefficient (R) of -0.320 and weighted average of $51,246, a difference of 0.84%.
Median Earnings Correlation Summary
| Measurement | Immigrants from Netherlands | New Zealander |
| Minimum | $8,447 | $11,591 |
| Maximum | $88,336 | $104,409 |
| Range | $79,889 | $92,818 |
| Mean | $47,130 | $49,845 |
| Median | $49,796 | $50,398 |
| Interquartile 25% (IQ1) | $38,138 | $37,107 |
| Interquartile 75% (IQ3) | $56,269 | $57,034 |
| Interquartile Range (IQR) | $18,130 | $19,927 |
| Standard Deviation (Sample) | $16,545 | $19,630 |
| Standard Deviation (Population) | $16,360 | $19,383 |
Demographics Similar to Immigrants from Netherlands and New Zealanders by Median Earnings
In terms of median earnings, the demographic groups most similar to Immigrants from Netherlands are South African ($50,752, a difference of 0.13%), Immigrants from Scotland ($50,741, a difference of 0.15%), Immigrants from Egypt ($50,901, a difference of 0.16%), Immigrants from Ukraine ($50,984, a difference of 0.33%), and Lithuanian ($50,991, a difference of 0.34%). Similarly, the demographic groups most similar to New Zealanders are Immigrants from Bulgaria ($51,318, a difference of 0.14%), Greek ($51,164, a difference of 0.16%), Immigrants from Romania ($51,337, a difference of 0.18%), Afghan ($51,112, a difference of 0.26%), and Immigrants from Spain ($51,092, a difference of 0.30%).
| Demographics | Rating | Rank | Median Earnings |
| Immigrants | Bolivia | 99.9 /100 | #58 | Exceptional $51,605 |
| Immigrants | Croatia | 99.9 /100 | #59 | Exceptional $51,581 |
| Immigrants | Serbia | 99.9 /100 | #60 | Exceptional $51,557 |
| Immigrants | Latvia | 99.9 /100 | #61 | Exceptional $51,555 |
| Immigrants | Romania | 99.9 /100 | #62 | Exceptional $51,337 |
| Immigrants | Bulgaria | 99.9 /100 | #63 | Exceptional $51,318 |
| New Zealanders | 99.9 /100 | #64 | Exceptional $51,246 |
| Greeks | 99.9 /100 | #65 | Exceptional $51,164 |
| Afghans | 99.9 /100 | #66 | Exceptional $51,112 |
| Immigrants | Spain | 99.9 /100 | #67 | Exceptional $51,092 |
| Paraguayans | 99.9 /100 | #68 | Exceptional $51,068 |
| Mongolians | 99.8 /100 | #69 | Exceptional $51,038 |
| Lithuanians | 99.8 /100 | #70 | Exceptional $50,991 |
| Immigrants | Ukraine | 99.8 /100 | #71 | Exceptional $50,984 |
| Immigrants | Egypt | 99.8 /100 | #72 | Exceptional $50,901 |
| Immigrants | Netherlands | 99.8 /100 | #73 | Exceptional $50,818 |
| South Africans | 99.8 /100 | #74 | Exceptional $50,752 |
| Immigrants | Scotland | 99.8 /100 | #75 | Exceptional $50,741 |
| Immigrants | Italy | 99.7 /100 | #76 | Exceptional $50,581 |
| Immigrants | Western Europe | 99.7 /100 | #77 | Exceptional $50,549 |
| Argentineans | 99.6 /100 | #78 | Exceptional $50,399 |