Immigrants from Netherlands vs Immigrants from Dominican Republic Child Poverty Under the Age of 5
COMPARE
Immigrants from Netherlands
Immigrants from Dominican Republic
Child Poverty Under the Age of 5
Child Poverty Under the Age of 5 Comparison
Immigrants from Netherlands
Immigrants from Dominican Republic
15.6%
CHILD POVERTY UNDER THE AGE OF 5
97.6/ 100
METRIC RATING
84th/ 347
METRIC RANK
24.1%
CHILD POVERTY UNDER THE AGE OF 5
0.0/ 100
METRIC RATING
328th/ 347
METRIC RANK
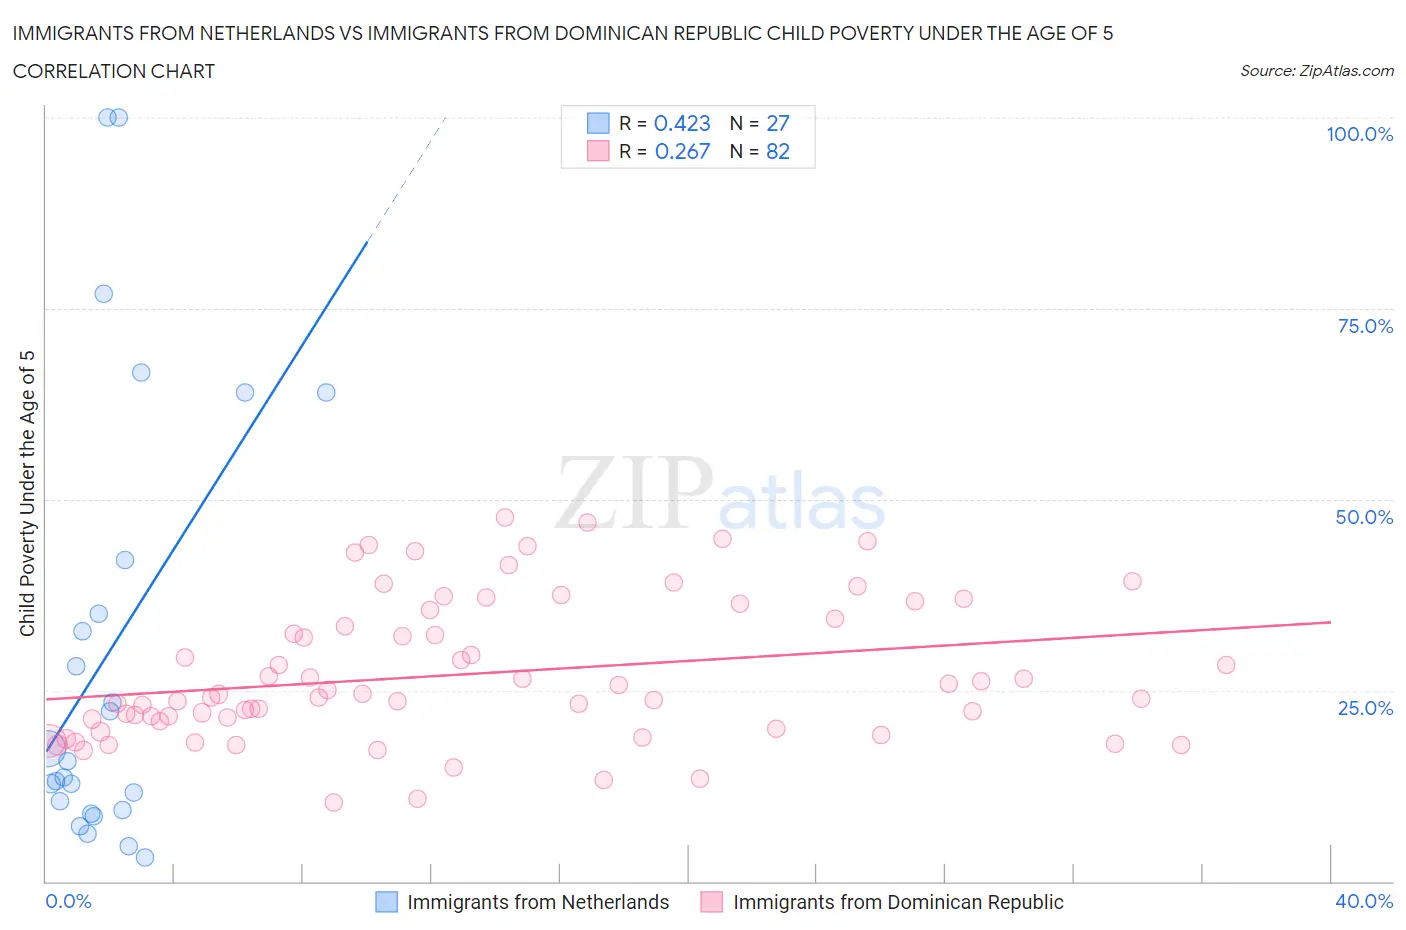
Immigrants from Netherlands vs Immigrants from Dominican Republic Child Poverty Under the Age of 5 Correlation Chart
The statistical analysis conducted on geographies consisting of 229,684,544 people shows a moderate positive correlation between the proportion of Immigrants from Netherlands and poverty level among children under the age of 5 in the United States with a correlation coefficient (R) of 0.423 and weighted average of 15.6%. Similarly, the statistical analysis conducted on geographies consisting of 266,224,644 people shows a weak positive correlation between the proportion of Immigrants from Dominican Republic and poverty level among children under the age of 5 in the United States with a correlation coefficient (R) of 0.267 and weighted average of 24.1%, a difference of 54.4%.
Child Poverty Under the Age of 5 Correlation Summary
| Measurement | Immigrants from Netherlands | Immigrants from Dominican Republic |
| Minimum | 3.0% | 10.3% |
| Maximum | 100.0% | 47.5% |
| Range | 97.0% | 37.2% |
| Mean | 30.0% | 27.1% |
| Median | 15.7% | 24.3% |
| Interquartile 25% (IQ1) | 9.3% | 20.9% |
| Interquartile 75% (IQ3) | 42.1% | 34.4% |
| Interquartile Range (IQR) | 32.8% | 13.5% |
| Standard Deviation (Sample) | 29.1% | 9.2% |
| Standard Deviation (Population) | 28.5% | 9.1% |
Similar Demographics by Child Poverty Under the Age of 5
Demographics Similar to Immigrants from Netherlands by Child Poverty Under the Age of 5
In terms of child poverty under the age of 5, the demographic groups most similar to Immigrants from Netherlands are Chilean (15.6%, a difference of 0.020%), Immigrants from Latvia (15.6%, a difference of 0.16%), Immigrants from Malaysia (15.6%, a difference of 0.16%), Immigrants from Italy (15.6%, a difference of 0.18%), and Immigrants from Vietnam (15.6%, a difference of 0.24%).
| Demographics | Rating | Rank | Child Poverty Under the Age of 5 |
| Immigrants | Turkey | 98.3 /100 | #77 | Exceptional 15.4% |
| Sri Lankans | 98.1 /100 | #78 | Exceptional 15.5% |
| Australians | 98.0 /100 | #79 | Exceptional 15.5% |
| Italians | 97.9 /100 | #80 | Exceptional 15.5% |
| Czechs | 97.8 /100 | #81 | Exceptional 15.5% |
| Immigrants | Italy | 97.7 /100 | #82 | Exceptional 15.6% |
| Chileans | 97.6 /100 | #83 | Exceptional 15.6% |
| Immigrants | Netherlands | 97.6 /100 | #84 | Exceptional 15.6% |
| Immigrants | Latvia | 97.4 /100 | #85 | Exceptional 15.6% |
| Immigrants | Malaysia | 97.4 /100 | #86 | Exceptional 15.6% |
| Immigrants | Vietnam | 97.4 /100 | #87 | Exceptional 15.6% |
| Jordanians | 97.3 /100 | #88 | Exceptional 15.6% |
| Immigrants | Croatia | 97.3 /100 | #89 | Exceptional 15.6% |
| Immigrants | France | 97.3 /100 | #90 | Exceptional 15.6% |
| Poles | 97.2 /100 | #91 | Exceptional 15.7% |
Demographics Similar to Immigrants from Dominican Republic by Child Poverty Under the Age of 5
In terms of child poverty under the age of 5, the demographic groups most similar to Immigrants from Dominican Republic are Dominican (24.0%, a difference of 0.090%), Cajun (24.1%, a difference of 0.23%), Central American Indian (23.9%, a difference of 0.55%), Creek (24.2%, a difference of 0.67%), and Immigrants from Congo (23.9%, a difference of 0.73%).
| Demographics | Rating | Rank | Child Poverty Under the Age of 5 |
| Immigrants | Honduras | 0.0 /100 | #321 | Tragic 23.5% |
| Ute | 0.0 /100 | #322 | Tragic 23.5% |
| Pueblo | 0.0 /100 | #323 | Tragic 23.7% |
| Paiute | 0.0 /100 | #324 | Tragic 23.8% |
| Immigrants | Congo | 0.0 /100 | #325 | Tragic 23.9% |
| Central American Indians | 0.0 /100 | #326 | Tragic 23.9% |
| Dominicans | 0.0 /100 | #327 | Tragic 24.0% |
| Immigrants | Dominican Republic | 0.0 /100 | #328 | Tragic 24.1% |
| Cajuns | 0.0 /100 | #329 | Tragic 24.1% |
| Creek | 0.0 /100 | #330 | Tragic 24.2% |
| Kiowa | 0.0 /100 | #331 | Tragic 24.5% |
| Apache | 0.0 /100 | #332 | Tragic 25.0% |
| Natives/Alaskans | 0.0 /100 | #333 | Tragic 25.6% |
| Blacks/African Americans | 0.0 /100 | #334 | Tragic 25.7% |
| Colville | 0.0 /100 | #335 | Tragic 25.7% |