Immigrants from Netherlands vs New Zealander Median Female Earnings
COMPARE
Immigrants from Netherlands
New Zealander
Median Female Earnings
Median Female Earnings Comparison
Immigrants from Netherlands
New Zealanders
$41,870
MEDIAN FEMALE EARNINGS
98.9/ 100
METRIC RATING
95th/ 347
METRIC RANK
$42,446
MEDIAN FEMALE EARNINGS
99.7/ 100
METRIC RATING
75th/ 347
METRIC RANK
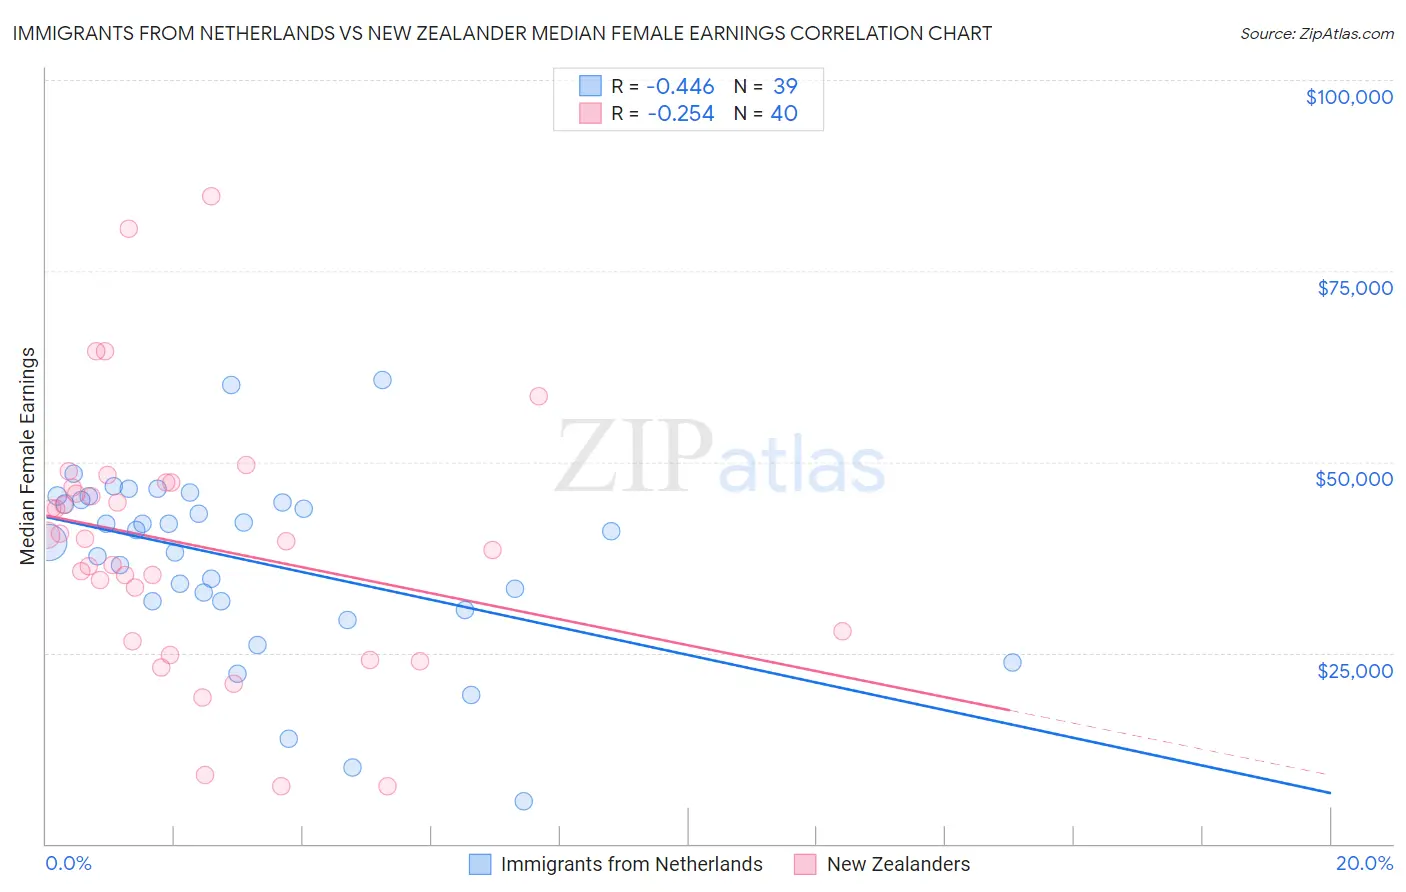
Immigrants from Netherlands vs New Zealander Median Female Earnings Correlation Chart
The statistical analysis conducted on geographies consisting of 237,807,250 people shows a moderate negative correlation between the proportion of Immigrants from Netherlands and median female earnings in the United States with a correlation coefficient (R) of -0.446 and weighted average of $41,870. Similarly, the statistical analysis conducted on geographies consisting of 106,911,016 people shows a weak negative correlation between the proportion of New Zealanders and median female earnings in the United States with a correlation coefficient (R) of -0.254 and weighted average of $42,446, a difference of 1.4%.
Median Female Earnings Correlation Summary
| Measurement | Immigrants from Netherlands | New Zealander |
| Minimum | $5,512 | $7,500 |
| Maximum | $60,703 | $84,792 |
| Range | $55,191 | $77,292 |
| Mean | $37,129 | $39,221 |
| Median | $40,875 | $39,778 |
| Interquartile 25% (IQ1) | $31,744 | $27,127 |
| Interquartile 75% (IQ3) | $45,060 | $46,939 |
| Interquartile Range (IQR) | $13,315 | $19,812 |
| Standard Deviation (Sample) | $11,943 | $16,864 |
| Standard Deviation (Population) | $11,789 | $16,651 |
Demographics Similar to Immigrants from Netherlands and New Zealanders by Median Female Earnings
In terms of median female earnings, the demographic groups most similar to Immigrants from Netherlands are Moroccan ($41,872, a difference of 0.0%), Immigrants from Grenada ($41,932, a difference of 0.15%), Argentinean ($41,952, a difference of 0.20%), Immigrants from Western Europe ($41,990, a difference of 0.29%), and Ukrainian ($42,015, a difference of 0.35%). Similarly, the demographic groups most similar to New Zealanders are Immigrants from Italy ($42,446, a difference of 0.0%), Immigrants from Albania ($42,388, a difference of 0.14%), Immigrants from Kazakhstan ($42,386, a difference of 0.14%), Greek ($42,336, a difference of 0.26%), and Immigrants from Moldova ($42,304, a difference of 0.34%).
| Demographics | Rating | Rank | Median Female Earnings |
| New Zealanders | 99.7 /100 | #75 | Exceptional $42,446 |
| Immigrants | Italy | 99.7 /100 | #76 | Exceptional $42,446 |
| Immigrants | Albania | 99.6 /100 | #77 | Exceptional $42,388 |
| Immigrants | Kazakhstan | 99.6 /100 | #78 | Exceptional $42,386 |
| Greeks | 99.6 /100 | #79 | Exceptional $42,336 |
| Immigrants | Moldova | 99.6 /100 | #80 | Exceptional $42,304 |
| Immigrants | Southern Europe | 99.5 /100 | #81 | Exceptional $42,275 |
| Immigrants | Morocco | 99.5 /100 | #82 | Exceptional $42,229 |
| Immigrants | Sierra Leone | 99.5 /100 | #83 | Exceptional $42,214 |
| Armenians | 99.5 /100 | #84 | Exceptional $42,212 |
| Laotians | 99.4 /100 | #85 | Exceptional $42,133 |
| Immigrants | St. Vincent and the Grenadines | 99.3 /100 | #86 | Exceptional $42,108 |
| Lithuanians | 99.3 /100 | #87 | Exceptional $42,108 |
| Immigrants | Northern Africa | 99.3 /100 | #88 | Exceptional $42,084 |
| Immigrants | Afghanistan | 99.3 /100 | #89 | Exceptional $42,055 |
| Ukrainians | 99.2 /100 | #90 | Exceptional $42,015 |
| Immigrants | Western Europe | 99.2 /100 | #91 | Exceptional $41,990 |
| Argentineans | 99.1 /100 | #92 | Exceptional $41,952 |
| Immigrants | Grenada | 99.0 /100 | #93 | Exceptional $41,932 |
| Moroccans | 98.9 /100 | #94 | Exceptional $41,872 |
| Immigrants | Netherlands | 98.9 /100 | #95 | Exceptional $41,870 |