Immigrants from Netherlands vs French Child Poverty Under the Age of 5
COMPARE
Immigrants from Netherlands
French
Child Poverty Under the Age of 5
Child Poverty Under the Age of 5 Comparison
Immigrants from Netherlands
French
15.6%
CHILD POVERTY UNDER THE AGE OF 5
97.6/ 100
METRIC RATING
84th/ 347
METRIC RANK
17.5%
CHILD POVERTY UNDER THE AGE OF 5
33.6/ 100
METRIC RATING
189th/ 347
METRIC RANK
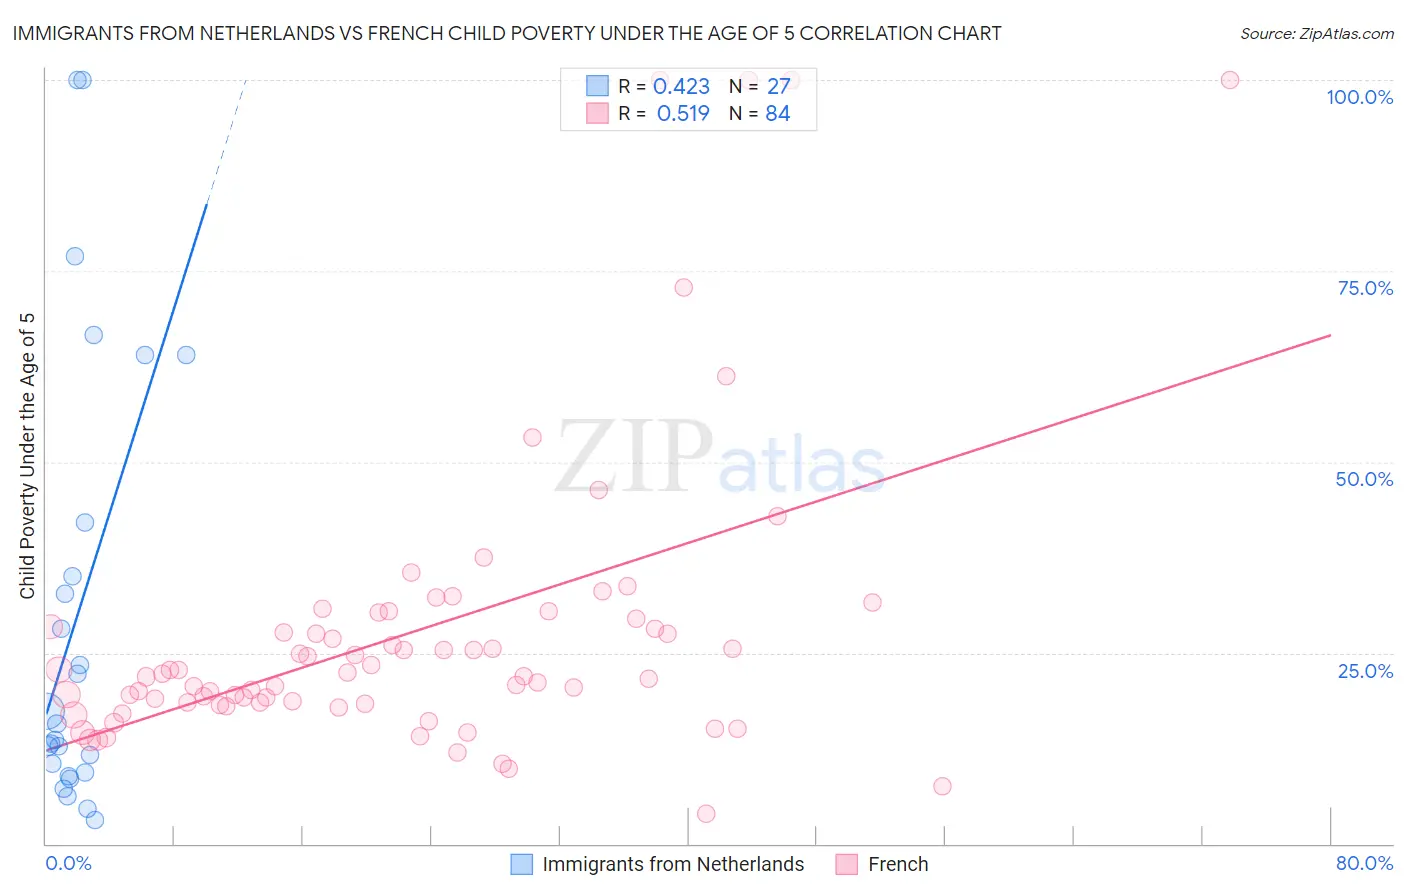
Immigrants from Netherlands vs French Child Poverty Under the Age of 5 Correlation Chart
The statistical analysis conducted on geographies consisting of 229,684,544 people shows a moderate positive correlation between the proportion of Immigrants from Netherlands and poverty level among children under the age of 5 in the United States with a correlation coefficient (R) of 0.423 and weighted average of 15.6%. Similarly, the statistical analysis conducted on geographies consisting of 531,494,079 people shows a substantial positive correlation between the proportion of French and poverty level among children under the age of 5 in the United States with a correlation coefficient (R) of 0.519 and weighted average of 17.5%, a difference of 12.6%.
Child Poverty Under the Age of 5 Correlation Summary
| Measurement | Immigrants from Netherlands | French |
| Minimum | 3.0% | 4.0% |
| Maximum | 100.0% | 100.0% |
| Range | 97.0% | 96.0% |
| Mean | 30.0% | 27.5% |
| Median | 15.7% | 22.1% |
| Interquartile 25% (IQ1) | 9.3% | 18.4% |
| Interquartile 75% (IQ3) | 42.1% | 28.9% |
| Interquartile Range (IQR) | 32.8% | 10.5% |
| Standard Deviation (Sample) | 29.1% | 19.4% |
| Standard Deviation (Population) | 28.5% | 19.3% |
Similar Demographics by Child Poverty Under the Age of 5
Demographics Similar to Immigrants from Netherlands by Child Poverty Under the Age of 5
In terms of child poverty under the age of 5, the demographic groups most similar to Immigrants from Netherlands are Chilean (15.6%, a difference of 0.020%), Immigrants from Latvia (15.6%, a difference of 0.16%), Immigrants from Malaysia (15.6%, a difference of 0.16%), Immigrants from Italy (15.6%, a difference of 0.18%), and Immigrants from Vietnam (15.6%, a difference of 0.24%).
| Demographics | Rating | Rank | Child Poverty Under the Age of 5 |
| Immigrants | Turkey | 98.3 /100 | #77 | Exceptional 15.4% |
| Sri Lankans | 98.1 /100 | #78 | Exceptional 15.5% |
| Australians | 98.0 /100 | #79 | Exceptional 15.5% |
| Italians | 97.9 /100 | #80 | Exceptional 15.5% |
| Czechs | 97.8 /100 | #81 | Exceptional 15.5% |
| Immigrants | Italy | 97.7 /100 | #82 | Exceptional 15.6% |
| Chileans | 97.6 /100 | #83 | Exceptional 15.6% |
| Immigrants | Netherlands | 97.6 /100 | #84 | Exceptional 15.6% |
| Immigrants | Latvia | 97.4 /100 | #85 | Exceptional 15.6% |
| Immigrants | Malaysia | 97.4 /100 | #86 | Exceptional 15.6% |
| Immigrants | Vietnam | 97.4 /100 | #87 | Exceptional 15.6% |
| Jordanians | 97.3 /100 | #88 | Exceptional 15.6% |
| Immigrants | Croatia | 97.3 /100 | #89 | Exceptional 15.6% |
| Immigrants | France | 97.3 /100 | #90 | Exceptional 15.6% |
| Poles | 97.2 /100 | #91 | Exceptional 15.7% |
Demographics Similar to French by Child Poverty Under the Age of 5
In terms of child poverty under the age of 5, the demographic groups most similar to French are Carpatho Rusyn (17.5%, a difference of 0.010%), Kenyan (17.5%, a difference of 0.12%), Immigrants from Bosnia and Herzegovina (17.5%, a difference of 0.16%), Immigrants from Armenia (17.5%, a difference of 0.49%), and Slovak (17.6%, a difference of 0.52%).
| Demographics | Rating | Rank | Child Poverty Under the Age of 5 |
| Arabs | 40.7 /100 | #182 | Average 17.4% |
| Lebanese | 40.3 /100 | #183 | Average 17.4% |
| Immigrants | Costa Rica | 39.0 /100 | #184 | Fair 17.4% |
| Immigrants | Armenia | 38.0 /100 | #185 | Fair 17.5% |
| Immigrants | Bosnia and Herzegovina | 35.0 /100 | #186 | Fair 17.5% |
| Kenyans | 34.7 /100 | #187 | Fair 17.5% |
| Carpatho Rusyns | 33.6 /100 | #188 | Fair 17.5% |
| French | 33.6 /100 | #189 | Fair 17.5% |
| Slovaks | 29.2 /100 | #190 | Fair 17.6% |
| Immigrants | Afghanistan | 27.9 /100 | #191 | Fair 17.7% |
| Immigrants | Uruguay | 27.8 /100 | #192 | Fair 17.7% |
| Immigrants | Uganda | 25.0 /100 | #193 | Fair 17.7% |
| French Canadians | 24.6 /100 | #194 | Fair 17.7% |
| Sierra Leoneans | 24.1 /100 | #195 | Fair 17.7% |
| Immigrants | Portugal | 22.2 /100 | #196 | Fair 17.8% |