Immigrants from Netherlands vs Panamanian Child Poverty Under the Age of 5
COMPARE
Immigrants from Netherlands
Panamanian
Child Poverty Under the Age of 5
Child Poverty Under the Age of 5 Comparison
Immigrants from Netherlands
Panamanians
15.6%
CHILD POVERTY UNDER THE AGE OF 5
97.6/ 100
METRIC RATING
84th/ 347
METRIC RANK
18.2%
CHILD POVERTY UNDER THE AGE OF 5
9.7/ 100
METRIC RATING
210th/ 347
METRIC RANK
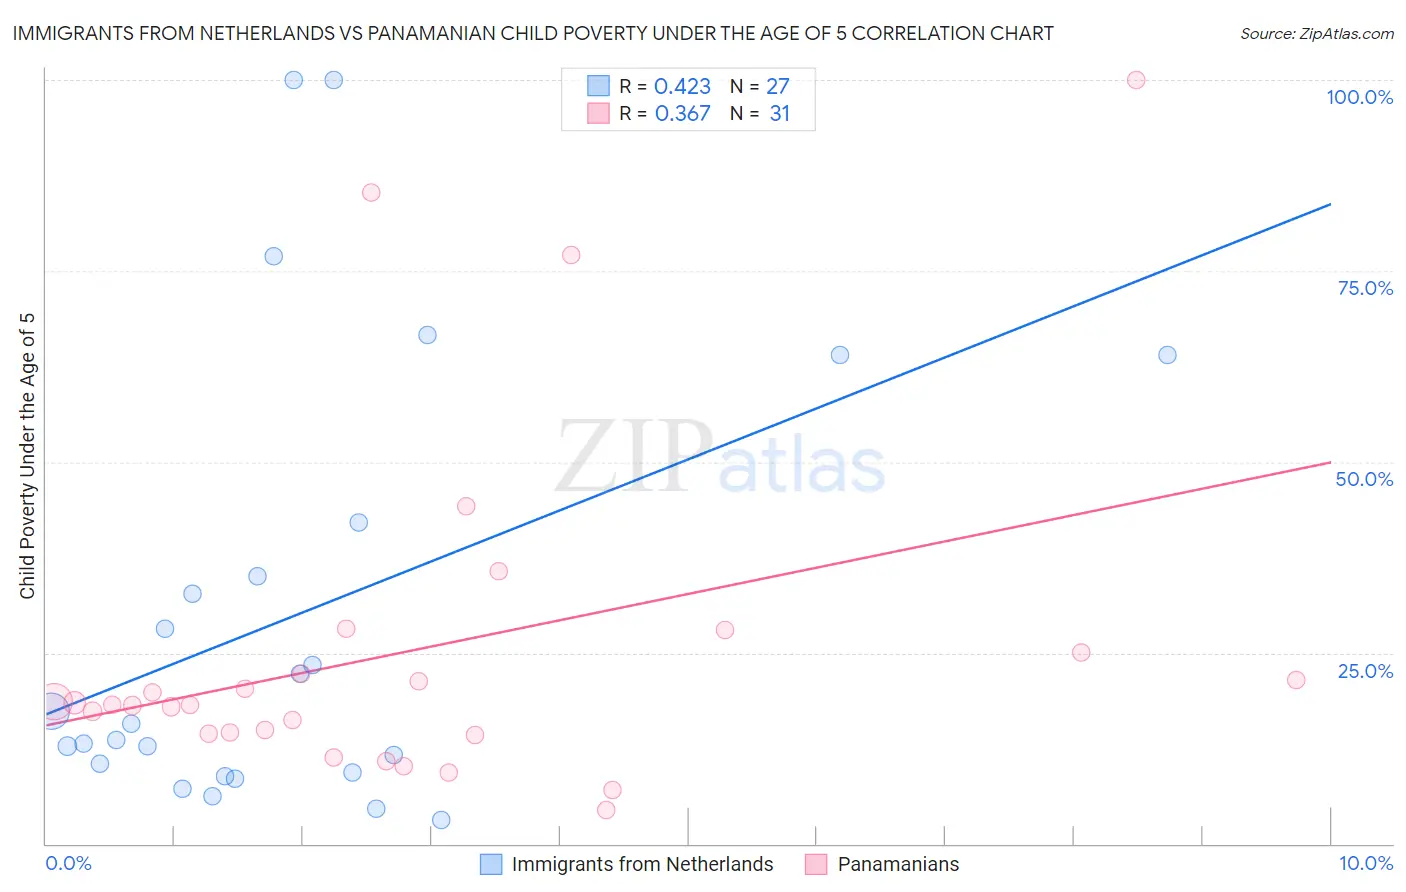
Immigrants from Netherlands vs Panamanian Child Poverty Under the Age of 5 Correlation Chart
The statistical analysis conducted on geographies consisting of 229,684,544 people shows a moderate positive correlation between the proportion of Immigrants from Netherlands and poverty level among children under the age of 5 in the United States with a correlation coefficient (R) of 0.423 and weighted average of 15.6%. Similarly, the statistical analysis conducted on geographies consisting of 275,258,393 people shows a mild positive correlation between the proportion of Panamanians and poverty level among children under the age of 5 in the United States with a correlation coefficient (R) of 0.367 and weighted average of 18.2%, a difference of 17.0%.
Child Poverty Under the Age of 5 Correlation Summary
| Measurement | Immigrants from Netherlands | Panamanian |
| Minimum | 3.0% | 4.3% |
| Maximum | 100.0% | 100.0% |
| Range | 97.0% | 95.7% |
| Mean | 30.0% | 25.2% |
| Median | 15.7% | 18.2% |
| Interquartile 25% (IQ1) | 9.3% | 14.4% |
| Interquartile 75% (IQ3) | 42.1% | 25.0% |
| Interquartile Range (IQR) | 32.8% | 10.6% |
| Standard Deviation (Sample) | 29.1% | 22.4% |
| Standard Deviation (Population) | 28.5% | 22.0% |
Similar Demographics by Child Poverty Under the Age of 5
Demographics Similar to Immigrants from Netherlands by Child Poverty Under the Age of 5
In terms of child poverty under the age of 5, the demographic groups most similar to Immigrants from Netherlands are Chilean (15.6%, a difference of 0.020%), Immigrants from Latvia (15.6%, a difference of 0.16%), Immigrants from Malaysia (15.6%, a difference of 0.16%), Immigrants from Italy (15.6%, a difference of 0.18%), and Immigrants from Vietnam (15.6%, a difference of 0.24%).
| Demographics | Rating | Rank | Child Poverty Under the Age of 5 |
| Immigrants | Turkey | 98.3 /100 | #77 | Exceptional 15.4% |
| Sri Lankans | 98.1 /100 | #78 | Exceptional 15.5% |
| Australians | 98.0 /100 | #79 | Exceptional 15.5% |
| Italians | 97.9 /100 | #80 | Exceptional 15.5% |
| Czechs | 97.8 /100 | #81 | Exceptional 15.5% |
| Immigrants | Italy | 97.7 /100 | #82 | Exceptional 15.6% |
| Chileans | 97.6 /100 | #83 | Exceptional 15.6% |
| Immigrants | Netherlands | 97.6 /100 | #84 | Exceptional 15.6% |
| Immigrants | Latvia | 97.4 /100 | #85 | Exceptional 15.6% |
| Immigrants | Malaysia | 97.4 /100 | #86 | Exceptional 15.6% |
| Immigrants | Vietnam | 97.4 /100 | #87 | Exceptional 15.6% |
| Jordanians | 97.3 /100 | #88 | Exceptional 15.6% |
| Immigrants | Croatia | 97.3 /100 | #89 | Exceptional 15.6% |
| Immigrants | France | 97.3 /100 | #90 | Exceptional 15.6% |
| Poles | 97.2 /100 | #91 | Exceptional 15.7% |
Demographics Similar to Panamanians by Child Poverty Under the Age of 5
In terms of child poverty under the age of 5, the demographic groups most similar to Panamanians are Spanish (18.2%, a difference of 0.010%), Scotch-Irish (18.2%, a difference of 0.020%), Immigrants (18.2%, a difference of 0.030%), Moroccan (18.2%, a difference of 0.090%), and Nepalese (18.3%, a difference of 0.30%).
| Demographics | Rating | Rank | Child Poverty Under the Age of 5 |
| Immigrants | Cambodia | 13.7 /100 | #203 | Poor 18.1% |
| Immigrants | Eastern Africa | 13.4 /100 | #204 | Poor 18.1% |
| Spaniards | 12.8 /100 | #205 | Poor 18.1% |
| Whites/Caucasians | 12.6 /100 | #206 | Poor 18.1% |
| Immigrants | Immigrants | 9.9 /100 | #207 | Tragic 18.2% |
| Scotch-Irish | 9.8 /100 | #208 | Tragic 18.2% |
| Spanish | 9.8 /100 | #209 | Tragic 18.2% |
| Panamanians | 9.7 /100 | #210 | Tragic 18.2% |
| Moroccans | 9.4 /100 | #211 | Tragic 18.2% |
| Nepalese | 8.7 /100 | #212 | Tragic 18.3% |
| Immigrants | Thailand | 8.6 /100 | #213 | Tragic 18.3% |
| Malaysians | 6.5 /100 | #214 | Tragic 18.4% |
| Immigrants | Panama | 6.0 /100 | #215 | Tragic 18.5% |
| Hmong | 5.0 /100 | #216 | Tragic 18.5% |
| Immigrants | Africa | 4.6 /100 | #217 | Tragic 18.6% |