Immigrants from Nepal vs Hawaiian Male Poverty

COMPARE

Immigrants from Nepal
Race
Ancestry
AfghanAfricanAlaska NativeAlaskan AthabascanAlbanianAleutAlsatianAmericanApacheArabArapahoArgentineanArmenianAssyrian/Chaldean/SyriacAustralianAustrianBahamianBangladeshiBarbadianBasqueBelgianBelizeanBermudanBhutaneseBlackfeetBolivianBrazilianBritishBritish West IndianBulgarianBurmeseCajunCambodianCanadianCape VerdeanCarpatho RusynCelticCentral AmericanCentral American IndianCherokeeCheyenneChickasawChileanChineseChippewaChoctawColombianColvilleComancheCosta RicanCreeCreekCroatianCrowCubanCypriotCzechCzechoslovakianDanishDelawareDominicanDutchDutch West IndianEastern EuropeanEcuadorianEgyptianEnglishEstonianEthiopianEuropeanFijianFilipinoFinnishFrenchFrench American IndianFrench CanadianGermanGerman RussianGhanaianGreekGuamanian/ChamorroGuatemalanGuyaneseHaitianHmongHonduranHopiHoumaHungarianIcelanderIndian (Asian)IndonesianInupiatIranianIraqiIrishIroquoisIsraeliItalianJamaicanJapaneseJordanianKenyanKiowaKoreanLaotianLatvianLebaneseLiberianLithuanianLumbeeLuxembourgerMacedonianMalaysianMalteseMarshalleseMenomineeMexicanMexican American IndianMongolianMoroccanNative HawaiianNavajoNepaleseNew ZealanderNicaraguanNigerianNorthern EuropeanNorwegianOkinawanOsageOttawaPaiutePakistaniPalestinianPanamanianParaguayanPennsylvania GermanPeruvianPimaPolishPortuguesePotawatomiPuebloPuerto RicanPuget Sound SalishRomanianRussianSalvadoranSamoanScandinavianScotch-IrishScottishSeminoleSenegaleseSerbianShoshoneSierra LeoneanSiouxSlavicSlovakSloveneSomaliSouth AfricanSouth AmericanSouth American IndianSoviet UnionSpaniardSpanishSpanish AmericanSpanish American IndianSri LankanSubsaharan AfricanSudaneseSwedishSwissSyrianTaiwaneseThaiTlingit-HaidaTohono O'OdhamTonganTrinidadian and TobagonianTsimshianTurkishU.S. Virgin IslanderUgandanUkrainianUruguayanUteVenezuelanVietnameseWelshWest IndianYakamaYaquiYugoslavianYumanYup'ikZimbabwean
Immigration
NonimmigrantsImmigrantsAfghanistanAfricaAlbaniaArgentinaArmeniaAsiaAustraliaAustriaBahamasBangladeshBarbadosBelarusBelgiumBelizeBoliviaBosnia and HerzegovinaBrazilBulgariaBurma/MyanmarCabo VerdeCambodiaCameroonCanadaCaribbeanCentral AmericaChileChinaColombiaCongoCosta RicaCroatiaCubaCzechoslovakiaDenmarkDominicaDominican RepublicEastern AfricaEastern AsiaEastern EuropeEcuadorEgyptEl SalvadorEnglandEritreaEthiopiaEuropeFijiFranceGermanyGhanaGreeceGrenadaGuatemalaGuyanaHaitiHondurasHong KongHungaryIndiaIndonesiaIranIraqIrelandIsraelItalyJamaicaJapanJordanKazakhstanKenyaKoreaKuwaitLaosLatin AmericaLatviaLebanonLiberiaLithuaniaMalaysiaMexicoMicronesiaMiddle AfricaMoldovaMoroccoNepalNetherlandsNicaraguaNigeriaNorth AmericaNorth MacedoniaNorthern AfricaNorthern EuropeNorwayOceaniaPakistanPanamaPeruPhilippinesPolandPortugalRomaniaRussiaSaudi ArabiaScotlandSenegalSerbiaSierra LeoneSingaporeSomaliaSouth AfricaSouth AmericaSouth Central AsiaSouth Eastern AsiaSouthern EuropeSpainSri LankaSt. Vincent and the GrenadinesSudanSwedenSwitzerlandSyriaTaiwanThailandTrinidad and TobagoTurkeyUgandaUkraineUruguayUzbekistanVenezuelaVietnamWest IndiesWestern AfricaWestern AsiaWestern EuropeYemenZaireZimbabweAzores
Hawaiian
Race
Ancestry
AfghanAfricanAlaska NativeAlaskan AthabascanAlbanianAleutAlsatianAmericanApacheArabArapahoArgentineanArmenianAssyrian/Chaldean/SyriacAustralianAustrianBahamianBangladeshiBarbadianBasqueBelgianBelizeanBermudanBhutaneseBlackfeetBolivianBrazilianBritishBritish West IndianBulgarianBurmeseCajunCambodianCanadianCape VerdeanCarpatho RusynCelticCentral AmericanCentral American IndianCherokeeCheyenneChickasawChileanChineseChippewaChoctawColombianColvilleComancheCosta RicanCreeCreekCroatianCrowCubanCypriotCzechCzechoslovakianDanishDelawareDominicanDutchDutch West IndianEastern EuropeanEcuadorianEgyptianEnglishEstonianEthiopianEuropeanFijianFilipinoFinnishFrenchFrench American IndianFrench CanadianGermanGerman RussianGhanaianGreekGuamanian/ChamorroGuatemalanGuyaneseHaitianHmongHonduranHopiHoumaHungarianIcelanderIndian (Asian)IndonesianInupiatIranianIraqiIrishIroquoisIsraeliItalianJamaicanJapaneseJordanianKenyanKiowaKoreanLaotianLatvianLebaneseLiberianLithuanianLumbeeLuxembourgerMacedonianMalaysianMalteseMarshalleseMenomineeMexicanMexican American IndianMongolianMoroccanNative HawaiianNavajoNepaleseNew ZealanderNicaraguanNigerianNorthern EuropeanNorwegianOkinawanOsageOttawaPaiutePakistaniPalestinianPanamanianParaguayanPennsylvania GermanPeruvianPimaPolishPortuguesePotawatomiPuebloPuerto RicanPuget Sound SalishRomanianRussianSalvadoranSamoanScandinavianScotch-IrishScottishSeminoleSenegaleseSerbianShoshoneSierra LeoneanSiouxSlavicSlovakSloveneSomaliSouth AfricanSouth AmericanSouth American IndianSoviet UnionSpaniardSpanishSpanish AmericanSpanish American IndianSri LankanSubsaharan AfricanSudaneseSwedishSwissSyrianTaiwaneseThaiTlingit-HaidaTohono O'OdhamTonganTrinidadian and TobagonianTsimshianTurkishU.S. Virgin IslanderUgandanUkrainianUruguayanUteVenezuelanVietnameseWelshWest IndianYakamaYaquiYugoslavianYumanYup'ikZimbabwean
Immigration
NonimmigrantsImmigrantsAfghanistanAfricaAlbaniaArgentinaArmeniaAsiaAustraliaAustriaBahamasBangladeshBarbadosBelarusBelgiumBelizeBoliviaBosnia and HerzegovinaBrazilBulgariaBurma/MyanmarCabo VerdeCambodiaCameroonCanadaCaribbeanCentral AmericaChileChinaColombiaCongoCosta RicaCroatiaCubaCzechoslovakiaDenmarkDominicaDominican RepublicEastern AfricaEastern AsiaEastern EuropeEcuadorEgyptEl SalvadorEnglandEritreaEthiopiaEuropeFijiFranceGermanyGhanaGreeceGrenadaGuatemalaGuyanaHaitiHondurasHong KongHungaryIndiaIndonesiaIranIraqIrelandIsraelItalyJamaicaJapanJordanKazakhstanKenyaKoreaKuwaitLaosLatin AmericaLatviaLebanonLiberiaLithuaniaMalaysiaMexicoMicronesiaMiddle AfricaMoldovaMoroccoNetherlandsNicaraguaNigeriaNorth AmericaNorth MacedoniaNorthern AfricaNorthern EuropeNorwayOceaniaPakistanPanamaPeruPhilippinesPolandPortugalRomaniaRussiaSaudi ArabiaScotlandSenegalSerbiaSierra LeoneSingaporeSomaliaSouth AfricaSouth AmericaSouth Central AsiaSouth Eastern AsiaSouthern EuropeSpainSri LankaSt. Vincent and the GrenadinesSudanSwedenSwitzerlandSyriaTaiwanThailandTrinidad and TobagoTurkeyUgandaUkraineUruguayUzbekistanVenezuelaVietnamWest IndiesWestern AfricaWestern AsiaWestern EuropeYemenZaireZimbabweAzores
Male Poverty
Income
Poverty
Unemployment
Labor Participation
Family Structure
Vehicle Availability
Education Level
Disability

Male Poverty Comparison

Immigrants from Nepal

Hawaiians

Good
Fair
11.0%
MALE POVERTY
67.3/ 100
METRIC RATING
152nd/ 347
METRIC RANK
11.4%
MALE POVERTY
28.3/ 100
METRIC RATING
189th/ 347
METRIC RANK

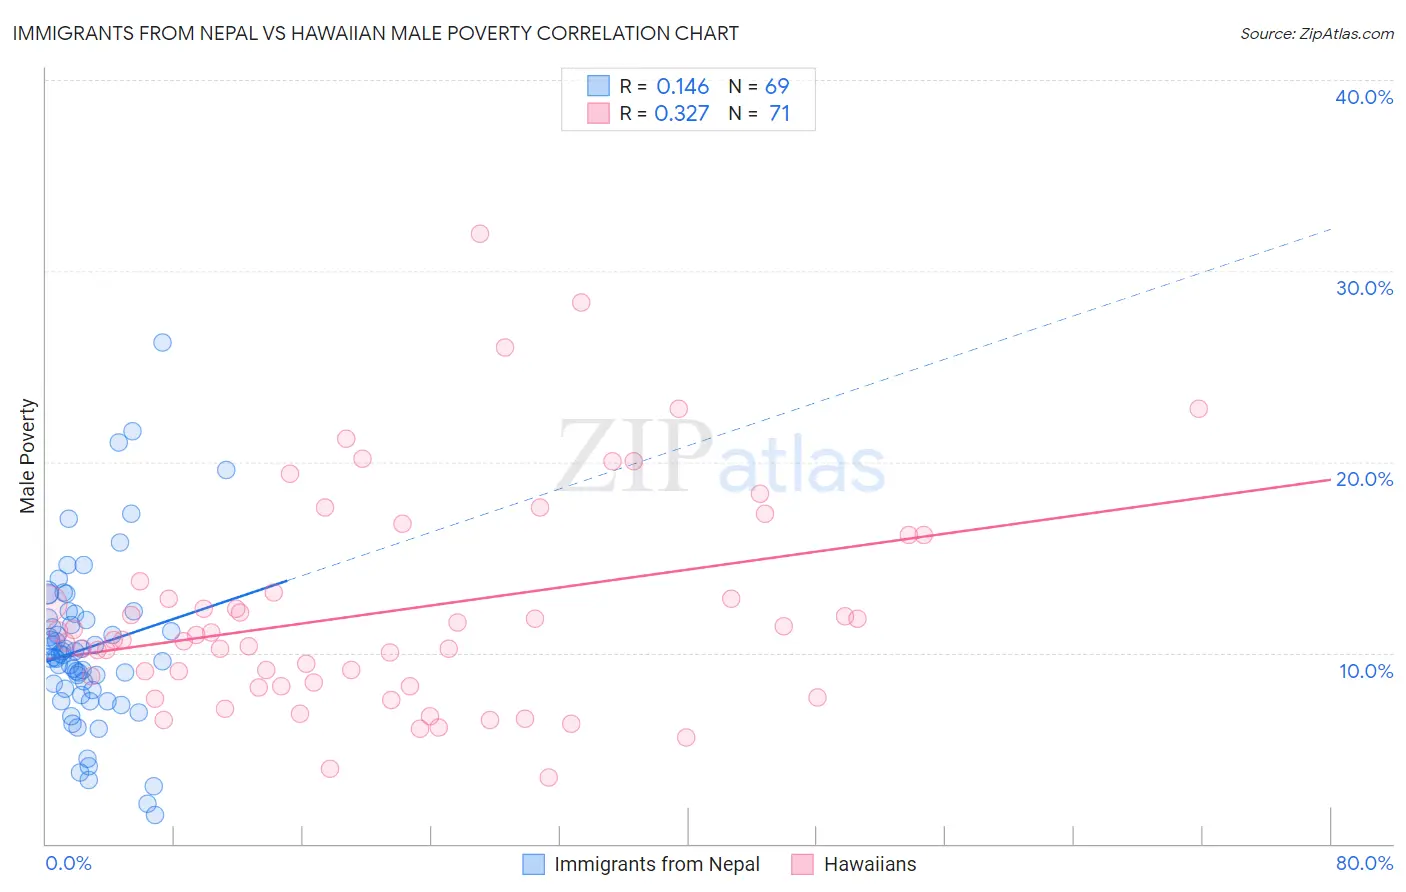
Immigrants from Nepal vs Hawaiian Male Poverty Correlation Chart

The statistical analysis conducted on geographies consisting of 186,636,323 people shows a poor positive correlation between the proportion of Immigrants from Nepal and poverty level among males in the United States with a correlation coefficient (R) of 0.146 and weighted average of 11.0%. Similarly, the statistical analysis conducted on geographies consisting of 327,329,663 people shows a mild positive correlation between the proportion of Hawaiians and poverty level among males in the United States with a correlation coefficient (R) of 0.327 and weighted average of 11.4%, a difference of 4.1%.
Immigrants from Nepal vs Hawaiian Male Poverty

Male Poverty Correlation Summary

MeasurementImmigrants from NepalHawaiian
Minimum1.5%3.5%
Maximum26.3%31.9%
Range24.7%28.5%
Mean10.3%12.2%
Median9.9%10.7%
Interquartile 25% (IQ1)7.9%8.3%
Interquartile 75% (IQ3)11.9%13.7%
Interquartile Range (IQR)4.0%5.4%
Standard Deviation (Sample)4.4%5.7%
Standard Deviation (Population)4.4%5.7%

Similar Demographics by Male Poverty

Demographics Similar to Immigrants from Nepal by Male Poverty

In terms of male poverty, the demographic groups most similar to Immigrants from Nepal are Venezuelan (11.0%, a difference of 0.0%), Guamanian/Chamorro (11.0%, a difference of 0.030%), Immigrants from Venezuela (11.0%, a difference of 0.070%), Armenian (11.0%, a difference of 0.080%), and Icelander (11.0%, a difference of 0.14%).
DemographicsRating | RankMale Poverty
Immigrants | Germany
71.6
/100
|
#145
Good
10.9%
Syrians
71.4
/100
|
#146
Good
10.9%
Icelanders
68.5
/100
|
#147
Good
11.0%
Armenians
68.0
/100
|
#148
Good
11.0%
Immigrants | Venezuela
67.9
/100
|
#149
Good
11.0%
Guamanians/Chamorros
67.6
/100
|
#150
Good
11.0%
Venezuelans
67.4
/100
|
#151
Good
11.0%
Immigrants | Nepal
67.3
/100
|
#152
Good
11.0%
Immigrants | Bosnia and Herzegovina
65.2
/100
|
#153
Good
11.0%
Immigrants | Kazakhstan
64.8
/100
|
#154
Good
11.0%
Immigrants | Malaysia
64.7
/100
|
#155
Good
11.0%
Costa Ricans
63.9
/100
|
#156
Good
11.0%
Scotch-Irish
63.7
/100
|
#157
Good
11.0%
Colombians
63.0
/100
|
#158
Good
11.0%
Taiwanese
62.7
/100
|
#159
Good
11.0%

Demographics Similar to Hawaiians by Male Poverty

In terms of male poverty, the demographic groups most similar to Hawaiians are Sierra Leonean (11.4%, a difference of 0.18%), Israeli (11.5%, a difference of 0.26%), Immigrants from Iraq (11.4%, a difference of 0.41%), Immigrants from Sierra Leone (11.4%, a difference of 0.52%), and Immigrants from Afghanistan (11.4%, a difference of 0.57%).
DemographicsRating | RankMale Poverty
Mongolians
39.0
/100
|
#182
Fair
11.3%
Kenyans
38.4
/100
|
#183
Fair
11.3%
Immigrants | South America
36.9
/100
|
#184
Fair
11.3%
Immigrants | Afghanistan
33.3
/100
|
#185
Fair
11.4%
Immigrants | Sierra Leone
32.9
/100
|
#186
Fair
11.4%
Immigrants | Iraq
31.9
/100
|
#187
Fair
11.4%
Sierra Leoneans
29.9
/100
|
#188
Fair
11.4%
Hawaiians
28.3
/100
|
#189
Fair
11.4%
Israelis
26.1
/100
|
#190
Fair
11.5%
South American Indians
22.8
/100
|
#191
Fair
11.5%
Immigrants | Uruguay
19.1
/100
|
#192
Poor
11.6%
Immigrants | Kuwait
17.3
/100
|
#193
Poor
11.6%
Immigrants | Kenya
16.1
/100
|
#194
Poor
11.6%
Arabs
15.8
/100
|
#195
Poor
11.6%
Hmong
15.8
/100
|
#196
Poor
11.6%