Immigrants from Nepal vs Immigrants from Ecuador Male Poverty
COMPARE
Immigrants from Nepal
Immigrants from Ecuador
Male Poverty
Male Poverty Comparison
Immigrants from Nepal
Immigrants from Ecuador
11.0%
MALE POVERTY
67.3/ 100
METRIC RATING
152nd/ 347
METRIC RANK
12.9%
MALE POVERTY
0.2/ 100
METRIC RATING
252nd/ 347
METRIC RANK
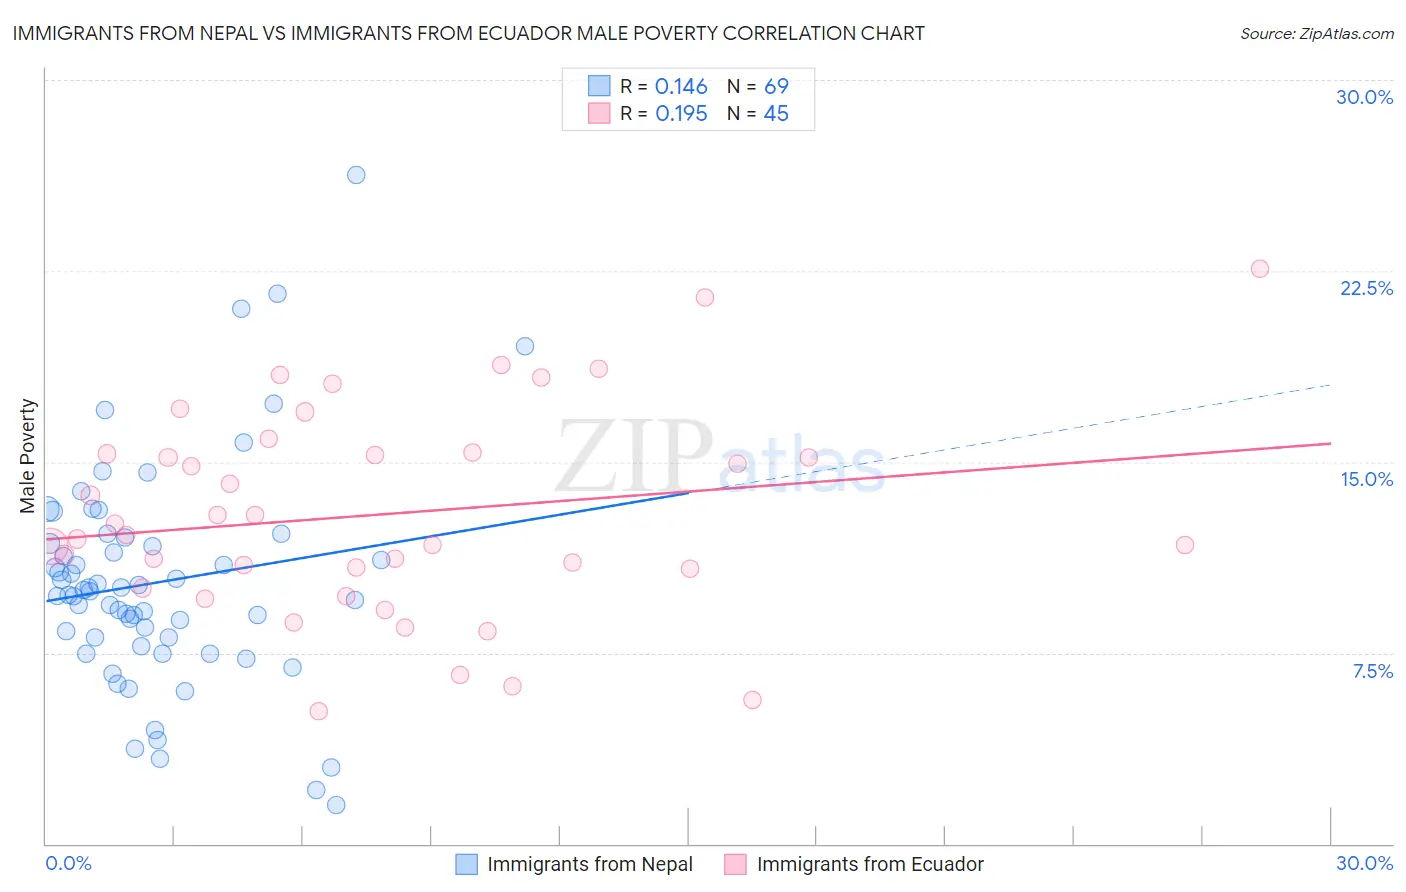
Immigrants from Nepal vs Immigrants from Ecuador Male Poverty Correlation Chart
The statistical analysis conducted on geographies consisting of 186,636,323 people shows a poor positive correlation between the proportion of Immigrants from Nepal and poverty level among males in the United States with a correlation coefficient (R) of 0.146 and weighted average of 11.0%. Similarly, the statistical analysis conducted on geographies consisting of 270,825,114 people shows a poor positive correlation between the proportion of Immigrants from Ecuador and poverty level among males in the United States with a correlation coefficient (R) of 0.195 and weighted average of 12.9%, a difference of 17.6%.
Male Poverty Correlation Summary
| Measurement | Immigrants from Nepal | Immigrants from Ecuador |
| Minimum | 1.5% | 5.2% |
| Maximum | 26.3% | 22.6% |
| Range | 24.7% | 17.4% |
| Mean | 10.3% | 13.0% |
| Median | 9.9% | 12.1% |
| Interquartile 25% (IQ1) | 7.9% | 10.4% |
| Interquartile 75% (IQ3) | 11.9% | 15.4% |
| Interquartile Range (IQR) | 4.0% | 4.9% |
| Standard Deviation (Sample) | 4.4% | 4.1% |
| Standard Deviation (Population) | 4.4% | 4.0% |
Similar Demographics by Male Poverty
Demographics Similar to Immigrants from Nepal by Male Poverty
In terms of male poverty, the demographic groups most similar to Immigrants from Nepal are Venezuelan (11.0%, a difference of 0.0%), Guamanian/Chamorro (11.0%, a difference of 0.030%), Immigrants from Venezuela (11.0%, a difference of 0.070%), Armenian (11.0%, a difference of 0.080%), and Icelander (11.0%, a difference of 0.14%).
| Demographics | Rating | Rank | Male Poverty |
| Immigrants | Germany | 71.6 /100 | #145 | Good 10.9% |
| Syrians | 71.4 /100 | #146 | Good 10.9% |
| Icelanders | 68.5 /100 | #147 | Good 11.0% |
| Armenians | 68.0 /100 | #148 | Good 11.0% |
| Immigrants | Venezuela | 67.9 /100 | #149 | Good 11.0% |
| Guamanians/Chamorros | 67.6 /100 | #150 | Good 11.0% |
| Venezuelans | 67.4 /100 | #151 | Good 11.0% |
| Immigrants | Nepal | 67.3 /100 | #152 | Good 11.0% |
| Immigrants | Bosnia and Herzegovina | 65.2 /100 | #153 | Good 11.0% |
| Immigrants | Kazakhstan | 64.8 /100 | #154 | Good 11.0% |
| Immigrants | Malaysia | 64.7 /100 | #155 | Good 11.0% |
| Costa Ricans | 63.9 /100 | #156 | Good 11.0% |
| Scotch-Irish | 63.7 /100 | #157 | Good 11.0% |
| Colombians | 63.0 /100 | #158 | Good 11.0% |
| Taiwanese | 62.7 /100 | #159 | Good 11.0% |
Demographics Similar to Immigrants from Ecuador by Male Poverty
In terms of male poverty, the demographic groups most similar to Immigrants from Ecuador are Immigrants from Cuba (12.9%, a difference of 0.030%), Immigrants from Ghana (12.9%, a difference of 0.050%), Immigrants from Nicaragua (12.9%, a difference of 0.13%), Potawatomi (12.9%, a difference of 0.14%), and Immigrants from Sudan (12.9%, a difference of 0.21%).
| Demographics | Rating | Rank | Male Poverty |
| Liberians | 0.3 /100 | #245 | Tragic 12.8% |
| Immigrants | El Salvador | 0.2 /100 | #246 | Tragic 12.8% |
| Immigrants | Western Africa | 0.2 /100 | #247 | Tragic 12.9% |
| Immigrants | Sudan | 0.2 /100 | #248 | Tragic 12.9% |
| Potawatomi | 0.2 /100 | #249 | Tragic 12.9% |
| Immigrants | Nicaragua | 0.2 /100 | #250 | Tragic 12.9% |
| Immigrants | Cuba | 0.2 /100 | #251 | Tragic 12.9% |
| Immigrants | Ecuador | 0.2 /100 | #252 | Tragic 12.9% |
| Immigrants | Ghana | 0.2 /100 | #253 | Tragic 12.9% |
| Mexican American Indians | 0.1 /100 | #254 | Tragic 13.0% |
| Immigrants | Liberia | 0.1 /100 | #255 | Tragic 13.0% |
| Immigrants | Burma/Myanmar | 0.1 /100 | #256 | Tragic 13.0% |
| Immigrants | Trinidad and Tobago | 0.1 /100 | #257 | Tragic 13.1% |
| Cape Verdeans | 0.1 /100 | #258 | Tragic 13.1% |
| Cherokee | 0.1 /100 | #259 | Tragic 13.1% |