Cajun vs Alaskan Athabascan Family Poverty

COMPARE

Cajun
Race
Ancestry
AfghanAfricanAlaska NativeAlbanianAleutAlsatianAmericanApacheArabArapahoArgentineanArmenianAssyrian/Chaldean/SyriacAustralianAustrianBahamianBangladeshiBarbadianBasqueBelgianBelizeanBermudanBhutaneseBlackfeetBolivianBrazilianBritishBritish West IndianBulgarianBurmeseCajunCambodianCanadianCape VerdeanCarpatho RusynCelticCentral AmericanCentral American IndianCherokeeCheyenneChickasawChileanChineseChippewaChoctawColombianColvilleComancheCosta RicanCreeCreekCroatianCrowCubanCypriotCzechCzechoslovakianDanishDelawareDominicanDutchDutch West IndianEastern EuropeanEcuadorianEgyptianEnglishEstonianEthiopianEuropeanFijianFilipinoFinnishFrenchFrench American IndianFrench CanadianGermanGerman RussianGhanaianGreekGuamanian/ChamorroGuatemalanGuyaneseHaitianHmongHonduranHopiHoumaHungarianIcelanderIndian (Asian)IndonesianInupiatIranianIraqiIrishIroquoisIsraeliItalianJamaicanJapaneseJordanianKenyanKiowaKoreanLaotianLatvianLebaneseLiberianLithuanianLumbeeLuxembourgerMacedonianMalaysianMalteseMarshalleseMenomineeMexicanMexican American IndianMongolianMoroccanNative HawaiianNavajoNepaleseNew ZealanderNicaraguanNigerianNorthern EuropeanNorwegianOkinawanOsageOttawaPaiutePakistaniPalestinianPanamanianParaguayanPennsylvania GermanPeruvianPimaPolishPortuguesePotawatomiPuebloPuerto RicanPuget Sound SalishRomanianRussianSalvadoranSamoanScandinavianScotch-IrishScottishSeminoleSenegaleseSerbianShoshoneSierra LeoneanSiouxSlavicSlovakSloveneSomaliSouth AfricanSouth AmericanSouth American IndianSoviet UnionSpaniardSpanishSpanish AmericanSpanish American IndianSri LankanSubsaharan AfricanSudaneseSwedishSwissSyrianTaiwaneseThaiTlingit-HaidaTohono O'OdhamTonganTrinidadian and TobagonianTsimshianTurkishU.S. Virgin IslanderUgandanUkrainianUruguayanUteVenezuelanVietnameseWelshWest IndianYakamaYaquiYugoslavianYumanYup'ikZimbabwean
Immigration
NonimmigrantsImmigrantsAfghanistanAfricaAlbaniaArgentinaArmeniaAsiaAustraliaAustriaBahamasBangladeshBarbadosBelarusBelgiumBelizeBoliviaBosnia and HerzegovinaBrazilBulgariaBurma/MyanmarCabo VerdeCambodiaCameroonCanadaCaribbeanCentral AmericaChileChinaColombiaCongoCosta RicaCroatiaCubaCzechoslovakiaDenmarkDominicaDominican RepublicEastern AfricaEastern AsiaEastern EuropeEcuadorEgyptEl SalvadorEnglandEritreaEthiopiaEuropeFijiFranceGermanyGhanaGreeceGrenadaGuatemalaGuyanaHaitiHondurasHong KongHungaryIndiaIndonesiaIranIraqIrelandIsraelItalyJamaicaJapanJordanKazakhstanKenyaKoreaKuwaitLaosLatin AmericaLatviaLebanonLiberiaLithuaniaMalaysiaMexicoMicronesiaMiddle AfricaMoldovaMoroccoNepalNetherlandsNicaraguaNigeriaNorth AmericaNorth MacedoniaNorthern AfricaNorthern EuropeNorwayOceaniaPakistanPanamaPeruPhilippinesPolandPortugalRomaniaRussiaSaudi ArabiaScotlandSenegalSerbiaSierra LeoneSingaporeSomaliaSouth AfricaSouth AmericaSouth Central AsiaSouth Eastern AsiaSouthern EuropeSpainSri LankaSt. Vincent and the GrenadinesSudanSwedenSwitzerlandSyriaTaiwanThailandTrinidad and TobagoTurkeyUgandaUkraineUruguayUzbekistanVenezuelaVietnamWest IndiesWestern AfricaWestern AsiaWestern EuropeYemenZaireZimbabweAzores
Alaskan Athabascan
Race
Ancestry
AfghanAfricanAlaska NativeAlaskan AthabascanAlbanianAleutAlsatianAmericanApacheArabArapahoArgentineanArmenianAssyrian/Chaldean/SyriacAustralianAustrianBahamianBangladeshiBarbadianBasqueBelgianBelizeanBermudanBhutaneseBlackfeetBolivianBrazilianBritishBritish West IndianBulgarianBurmeseCambodianCanadianCape VerdeanCarpatho RusynCelticCentral AmericanCentral American IndianCherokeeCheyenneChickasawChileanChineseChippewaChoctawColombianColvilleComancheCosta RicanCreeCreekCroatianCrowCubanCypriotCzechCzechoslovakianDanishDelawareDominicanDutchDutch West IndianEastern EuropeanEcuadorianEgyptianEnglishEstonianEthiopianEuropeanFijianFilipinoFinnishFrenchFrench American IndianFrench CanadianGermanGerman RussianGhanaianGreekGuamanian/ChamorroGuatemalanGuyaneseHaitianHmongHonduranHopiHoumaHungarianIcelanderIndian (Asian)IndonesianInupiatIranianIraqiIrishIroquoisIsraeliItalianJamaicanJapaneseJordanianKenyanKiowaKoreanLaotianLatvianLebaneseLiberianLithuanianLumbeeLuxembourgerMacedonianMalaysianMalteseMarshalleseMenomineeMexicanMexican American IndianMongolianMoroccanNative HawaiianNavajoNepaleseNew ZealanderNicaraguanNigerianNorthern EuropeanNorwegianOkinawanOsageOttawaPaiutePakistaniPalestinianPanamanianParaguayanPennsylvania GermanPeruvianPimaPolishPortuguesePotawatomiPuebloPuerto RicanPuget Sound SalishRomanianRussianSalvadoranSamoanScandinavianScotch-IrishScottishSeminoleSenegaleseSerbianShoshoneSierra LeoneanSiouxSlavicSlovakSloveneSomaliSouth AfricanSouth AmericanSouth American IndianSoviet UnionSpaniardSpanishSpanish AmericanSpanish American IndianSri LankanSubsaharan AfricanSudaneseSwedishSwissSyrianTaiwaneseThaiTlingit-HaidaTohono O'OdhamTonganTrinidadian and TobagonianTsimshianTurkishU.S. Virgin IslanderUgandanUkrainianUruguayanUteVenezuelanVietnameseWelshWest IndianYakamaYaquiYugoslavianYumanYup'ikZimbabwean
Immigration
NonimmigrantsImmigrantsAfghanistanAfricaAlbaniaArgentinaArmeniaAsiaAustraliaAustriaBahamasBangladeshBarbadosBelarusBelgiumBelizeBoliviaBosnia and HerzegovinaBrazilBulgariaBurma/MyanmarCabo VerdeCambodiaCameroonCanadaCaribbeanCentral AmericaChileChinaColombiaCongoCosta RicaCroatiaCubaCzechoslovakiaDenmarkDominicaDominican RepublicEastern AfricaEastern AsiaEastern EuropeEcuadorEgyptEl SalvadorEnglandEritreaEthiopiaEuropeFijiFranceGermanyGhanaGreeceGrenadaGuatemalaGuyanaHaitiHondurasHong KongHungaryIndiaIndonesiaIranIraqIrelandIsraelItalyJamaicaJapanJordanKazakhstanKenyaKoreaKuwaitLaosLatin AmericaLatviaLebanonLiberiaLithuaniaMalaysiaMexicoMicronesiaMiddle AfricaMoldovaMoroccoNepalNetherlandsNicaraguaNigeriaNorth AmericaNorth MacedoniaNorthern AfricaNorthern EuropeNorwayOceaniaPakistanPanamaPeruPhilippinesPolandPortugalRomaniaRussiaSaudi ArabiaScotlandSenegalSerbiaSierra LeoneSingaporeSomaliaSouth AfricaSouth AmericaSouth Central AsiaSouth Eastern AsiaSouthern EuropeSpainSri LankaSt. Vincent and the GrenadinesSudanSwedenSwitzerlandSyriaTaiwanThailandTrinidad and TobagoTurkeyUgandaUkraineUruguayUzbekistanVenezuelaVietnamWest IndiesWestern AfricaWestern AsiaWestern EuropeYemenZaireZimbabweAzores
Family Poverty
Income
Poverty
Unemployment
Labor Participation
Family Structure
Vehicle Availability
Education Level
Disability

Family Poverty Comparison

Cajuns

Alaskan Athabascans

Tragic
Tragic
11.9%
FAMILY POVERTY
0.0/ 100
METRIC RATING
306th/ 347
METRIC RANK
10.1%
FAMILY POVERTY
2.7/ 100
METRIC RATING
231st/ 347
METRIC RANK

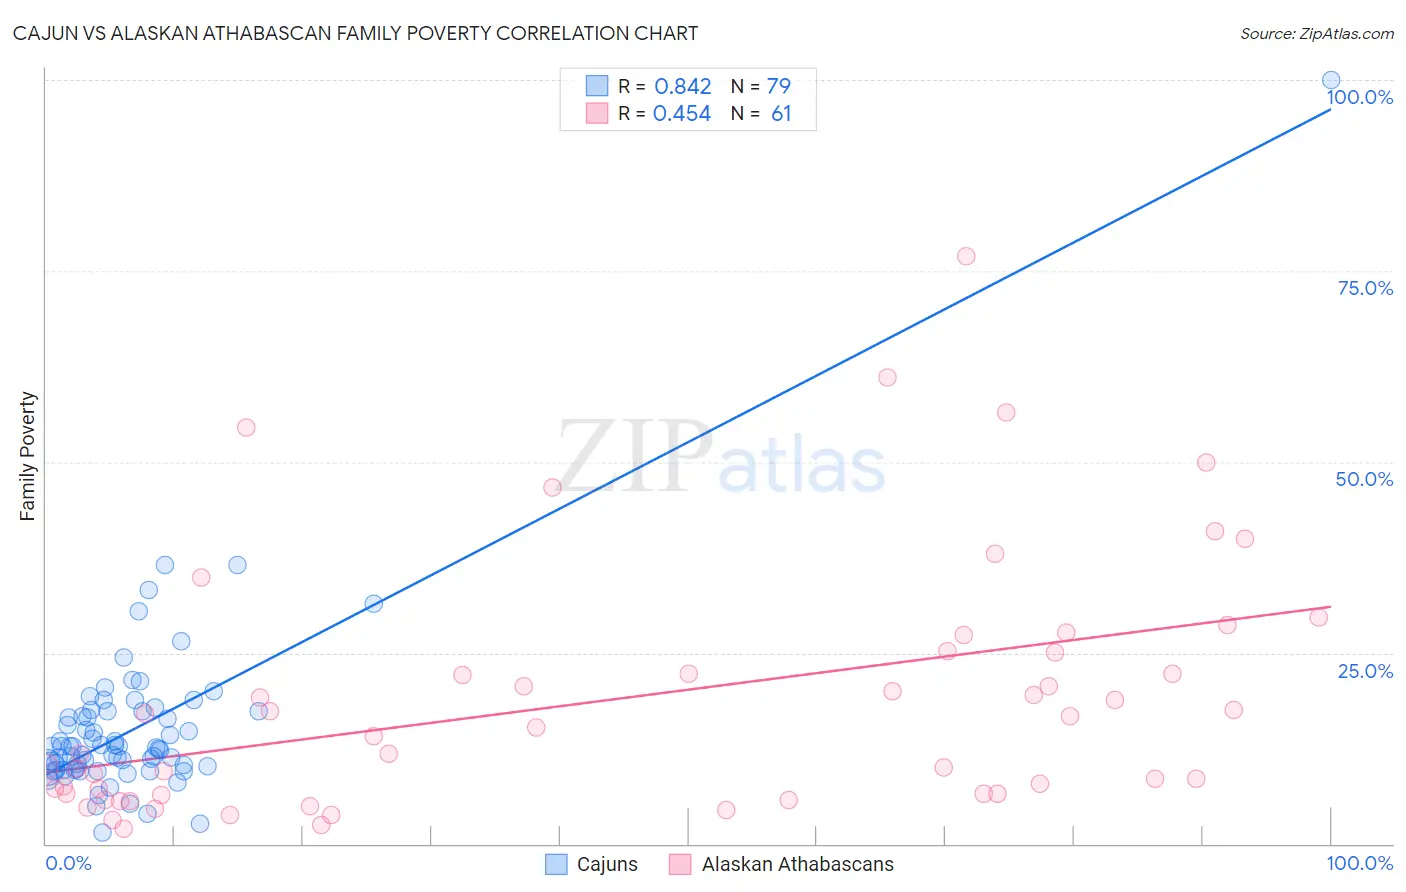
Cajun vs Alaskan Athabascan Family Poverty Correlation Chart

The statistical analysis conducted on geographies consisting of 149,591,536 people shows a very strong positive correlation between the proportion of Cajuns and poverty level among families in the United States with a correlation coefficient (R) of 0.842 and weighted average of 11.9%. Similarly, the statistical analysis conducted on geographies consisting of 45,790,128 people shows a moderate positive correlation between the proportion of Alaskan Athabascans and poverty level among families in the United States with a correlation coefficient (R) of 0.454 and weighted average of 10.1%, a difference of 18.1%.
Cajun vs Alaskan Athabascan Family Poverty

Family Poverty Correlation Summary

MeasurementCajunAlaskan Athabascan
Minimum1.5%2.0%
Maximum100.0%76.9%
Range98.5%74.9%
Mean15.2%18.8%
Median12.7%14.0%
Interquartile 25% (IQ1)9.9%6.5%
Interquartile 75% (IQ3)17.4%25.1%
Interquartile Range (IQR)7.5%18.6%
Standard Deviation (Sample)11.9%16.5%
Standard Deviation (Population)11.8%16.3%

Similar Demographics by Family Poverty

Demographics Similar to Cajuns by Family Poverty

In terms of family poverty, the demographic groups most similar to Cajuns are Immigrants from Congo (11.9%, a difference of 0.11%), Seminole (11.9%, a difference of 0.17%), Mexican (11.8%, a difference of 0.56%), Hispanic or Latino (12.0%, a difference of 0.61%), and Immigrants from Guatemala (12.0%, a difference of 0.62%).
DemographicsRating | RankFamily Poverty
Dutch West Indians
0.0
/100
|
#299
Tragic
11.7%
Immigrants | Bangladesh
0.0
/100
|
#300
Tragic
11.7%
Bahamians
0.0
/100
|
#301
Tragic
11.7%
Guatemalans
0.0
/100
|
#302
Tragic
11.7%
Africans
0.0
/100
|
#303
Tragic
11.8%
Immigrants | Latin America
0.0
/100
|
#304
Tragic
11.8%
Mexicans
0.0
/100
|
#305
Tragic
11.8%
Cajuns
0.0
/100
|
#306
Tragic
11.9%
Immigrants | Congo
0.0
/100
|
#307
Tragic
11.9%
Seminole
0.0
/100
|
#308
Tragic
11.9%
Hispanics or Latinos
0.0
/100
|
#309
Tragic
12.0%
Immigrants | Guatemala
0.0
/100
|
#310
Tragic
12.0%
Ute
0.0
/100
|
#311
Tragic
12.1%
Immigrants | Central America
0.0
/100
|
#312
Tragic
12.1%
Immigrants | Caribbean
0.0
/100
|
#313
Tragic
12.2%

Demographics Similar to Alaskan Athabascans by Family Poverty

In terms of family poverty, the demographic groups most similar to Alaskan Athabascans are Immigrants from Panama (10.0%, a difference of 0.38%), Immigrants from Uzbekistan (10.0%, a difference of 0.40%), Sudanese (10.0%, a difference of 0.41%), Immigrants from Sudan (10.1%, a difference of 0.43%), and Immigrants from Armenia (10.0%, a difference of 0.62%).
DemographicsRating | RankFamily Poverty
Marshallese
3.9
/100
|
#224
Tragic
9.9%
Immigrants | Immigrants
3.6
/100
|
#225
Tragic
10.0%
Ottawa
3.3
/100
|
#226
Tragic
10.0%
Immigrants | Armenia
3.3
/100
|
#227
Tragic
10.0%
Sudanese
3.1
/100
|
#228
Tragic
10.0%
Immigrants | Uzbekistan
3.1
/100
|
#229
Tragic
10.0%
Immigrants | Panama
3.1
/100
|
#230
Tragic
10.0%
Alaskan Athabascans
2.7
/100
|
#231
Tragic
10.1%
Immigrants | Sudan
2.3
/100
|
#232
Tragic
10.1%
Fijians
2.1
/100
|
#233
Tragic
10.1%
Immigrants | Middle Africa
2.1
/100
|
#234
Tragic
10.1%
Nigerians
2.0
/100
|
#235
Tragic
10.1%
Immigrants | Nigeria
1.9
/100
|
#236
Tragic
10.2%
Immigrants | Laos
1.7
/100
|
#237
Tragic
10.2%
French American Indians
1.5
/100
|
#238
Tragic
10.2%