Arab vs Alaskan Athabascan Family Poverty
COMPARE
Arab
Alaskan Athabascan
Family Poverty
Family Poverty Comparison
Arabs
Alaskan Athabascans
9.2%
FAMILY POVERTY
31.5/ 100
METRIC RATING
190th/ 347
METRIC RANK
10.1%
FAMILY POVERTY
2.7/ 100
METRIC RATING
231st/ 347
METRIC RANK
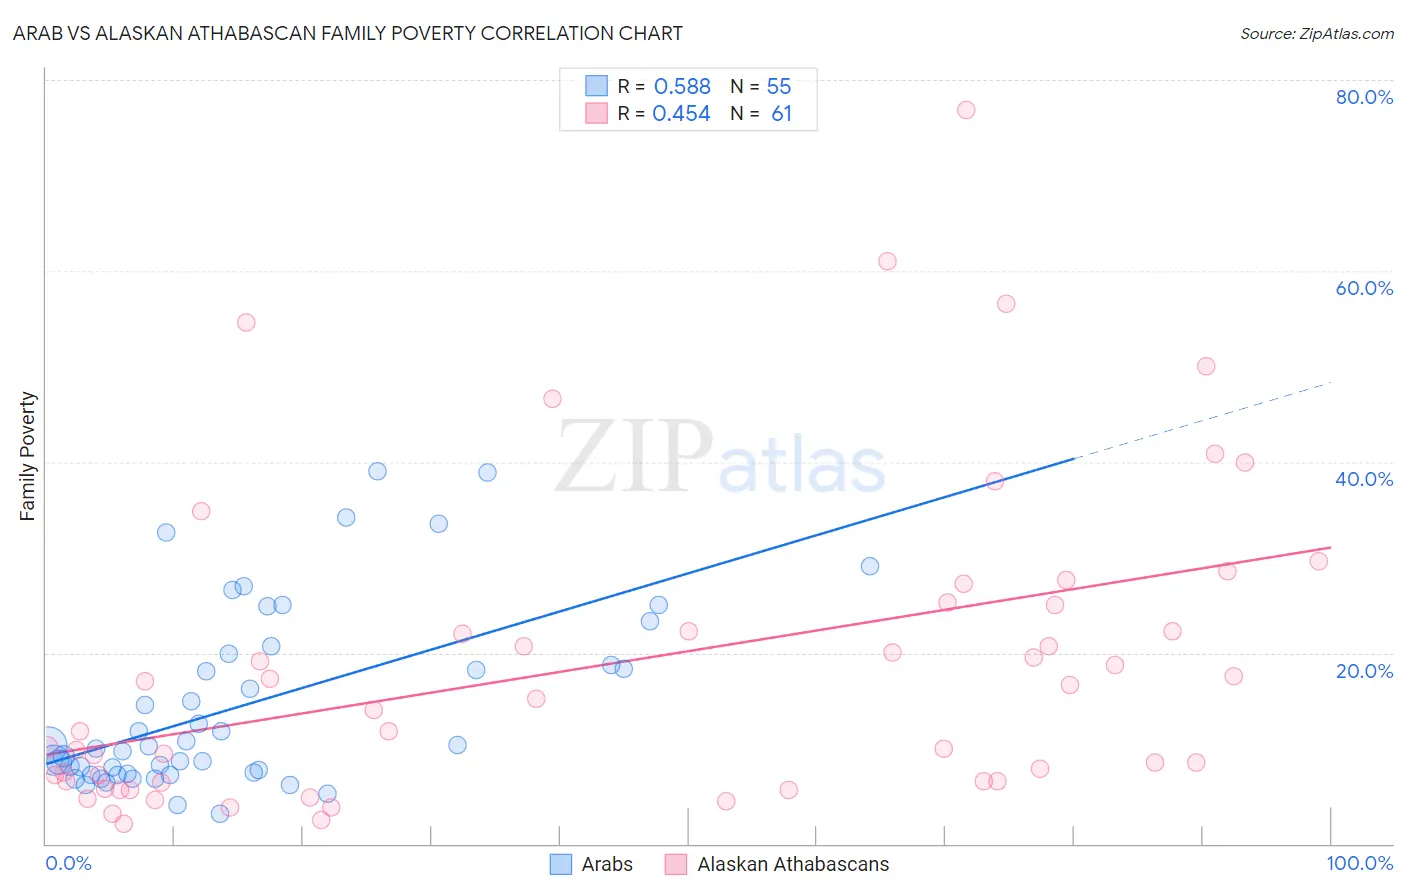
Arab vs Alaskan Athabascan Family Poverty Correlation Chart
The statistical analysis conducted on geographies consisting of 484,664,597 people shows a substantial positive correlation between the proportion of Arabs and poverty level among families in the United States with a correlation coefficient (R) of 0.588 and weighted average of 9.2%. Similarly, the statistical analysis conducted on geographies consisting of 45,790,128 people shows a moderate positive correlation between the proportion of Alaskan Athabascans and poverty level among families in the United States with a correlation coefficient (R) of 0.454 and weighted average of 10.1%, a difference of 9.0%.
Family Poverty Correlation Summary
| Measurement | Arab | Alaskan Athabascan |
| Minimum | 3.1% | 2.0% |
| Maximum | 39.0% | 76.9% |
| Range | 35.9% | 74.9% |
| Mean | 14.5% | 18.8% |
| Median | 10.2% | 14.0% |
| Interquartile 25% (IQ1) | 7.3% | 6.5% |
| Interquartile 75% (IQ3) | 19.9% | 25.1% |
| Interquartile Range (IQR) | 12.6% | 18.6% |
| Standard Deviation (Sample) | 9.5% | 16.5% |
| Standard Deviation (Population) | 9.4% | 16.3% |
Similar Demographics by Family Poverty
Demographics Similar to Arabs by Family Poverty
In terms of family poverty, the demographic groups most similar to Arabs are Immigrants from Afghanistan (9.2%, a difference of 0.090%), Immigrants from Kenya (9.2%, a difference of 0.37%), Ugandan (9.3%, a difference of 0.41%), Spanish (9.3%, a difference of 0.42%), and Immigrants from Western Asia (9.3%, a difference of 0.50%).
| Demographics | Rating | Rank | Family Poverty |
| Uruguayans | 39.2 /100 | #183 | Fair 9.1% |
| South American Indians | 38.7 /100 | #184 | Fair 9.1% |
| Immigrants | Saudi Arabia | 38.6 /100 | #185 | Fair 9.1% |
| Colombians | 36.1 /100 | #186 | Fair 9.2% |
| Delaware | 35.4 /100 | #187 | Fair 9.2% |
| Immigrants | Kenya | 34.0 /100 | #188 | Fair 9.2% |
| Immigrants | Afghanistan | 32.1 /100 | #189 | Fair 9.2% |
| Arabs | 31.5 /100 | #190 | Fair 9.2% |
| Ugandans | 28.7 /100 | #191 | Fair 9.3% |
| Spanish | 28.7 /100 | #192 | Fair 9.3% |
| Immigrants | Western Asia | 28.2 /100 | #193 | Fair 9.3% |
| South Americans | 28.1 /100 | #194 | Fair 9.3% |
| Venezuelans | 27.4 /100 | #195 | Fair 9.3% |
| Immigrants | Venezuela | 26.1 /100 | #196 | Fair 9.3% |
| Immigrants | Colombia | 24.4 /100 | #197 | Fair 9.3% |
Demographics Similar to Alaskan Athabascans by Family Poverty
In terms of family poverty, the demographic groups most similar to Alaskan Athabascans are Immigrants from Panama (10.0%, a difference of 0.38%), Immigrants from Uzbekistan (10.0%, a difference of 0.40%), Sudanese (10.0%, a difference of 0.41%), Immigrants from Sudan (10.1%, a difference of 0.43%), and Immigrants from Armenia (10.0%, a difference of 0.62%).
| Demographics | Rating | Rank | Family Poverty |
| Marshallese | 3.9 /100 | #224 | Tragic 9.9% |
| Immigrants | Immigrants | 3.6 /100 | #225 | Tragic 10.0% |
| Ottawa | 3.3 /100 | #226 | Tragic 10.0% |
| Immigrants | Armenia | 3.3 /100 | #227 | Tragic 10.0% |
| Sudanese | 3.1 /100 | #228 | Tragic 10.0% |
| Immigrants | Uzbekistan | 3.1 /100 | #229 | Tragic 10.0% |
| Immigrants | Panama | 3.1 /100 | #230 | Tragic 10.0% |
| Alaskan Athabascans | 2.7 /100 | #231 | Tragic 10.1% |
| Immigrants | Sudan | 2.3 /100 | #232 | Tragic 10.1% |
| Fijians | 2.1 /100 | #233 | Tragic 10.1% |
| Immigrants | Middle Africa | 2.1 /100 | #234 | Tragic 10.1% |
| Nigerians | 2.0 /100 | #235 | Tragic 10.1% |
| Immigrants | Nigeria | 1.9 /100 | #236 | Tragic 10.2% |
| Immigrants | Laos | 1.7 /100 | #237 | Tragic 10.2% |
| French American Indians | 1.5 /100 | #238 | Tragic 10.2% |