Immigrants from Moldova vs Immigrants Poverty
COMPARE
Immigrants from Moldova
Immigrants
Poverty
Poverty Comparison
Immigrants from Moldova
Immigrants
10.9%
POVERTY
99.1/ 100
METRIC RATING
44th/ 347
METRIC RANK
13.2%
POVERTY
4.3/ 100
METRIC RATING
212th/ 347
METRIC RANK
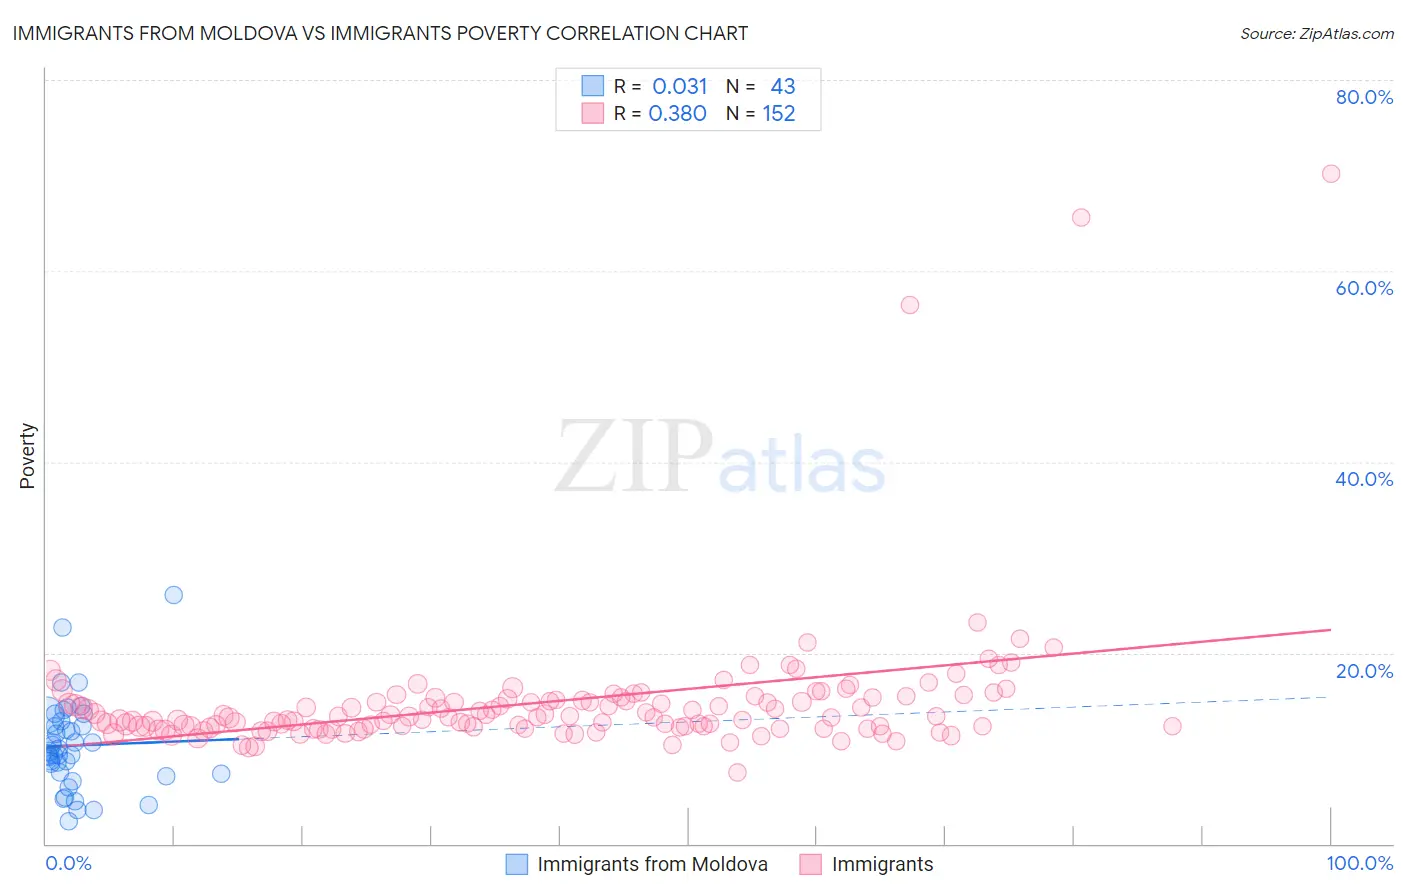
Immigrants from Moldova vs Immigrants Poverty Correlation Chart
The statistical analysis conducted on geographies consisting of 124,373,713 people shows no correlation between the proportion of Immigrants from Moldova and poverty level in the United States with a correlation coefficient (R) of 0.031 and weighted average of 10.9%. Similarly, the statistical analysis conducted on geographies consisting of 576,811,759 people shows a mild positive correlation between the proportion of Immigrants and poverty level in the United States with a correlation coefficient (R) of 0.380 and weighted average of 13.2%, a difference of 21.4%.
Poverty Correlation Summary
| Measurement | Immigrants from Moldova | Immigrants |
| Minimum | 2.4% | 7.5% |
| Maximum | 26.1% | 70.2% |
| Range | 23.7% | 62.7% |
| Mean | 10.3% | 14.8% |
| Median | 9.7% | 13.3% |
| Interquartile 25% (IQ1) | 7.4% | 12.3% |
| Interquartile 75% (IQ3) | 12.9% | 15.1% |
| Interquartile Range (IQR) | 5.5% | 2.8% |
| Standard Deviation (Sample) | 4.8% | 7.5% |
| Standard Deviation (Population) | 4.7% | 7.4% |
Similar Demographics by Poverty
Demographics Similar to Immigrants from Moldova by Poverty
In terms of poverty, the demographic groups most similar to Immigrants from Moldova are Immigrants from Singapore (10.9%, a difference of 0.14%), Korean (10.9%, a difference of 0.19%), Immigrants from Iran (10.9%, a difference of 0.41%), Russian (10.9%, a difference of 0.50%), and Turkish (11.0%, a difference of 0.51%).
| Demographics | Rating | Rank | Poverty |
| Immigrants | Greece | 99.3 /100 | #37 | Exceptional 10.8% |
| Czechs | 99.3 /100 | #38 | Exceptional 10.8% |
| Immigrants | Pakistan | 99.3 /100 | #39 | Exceptional 10.8% |
| Russians | 99.3 /100 | #40 | Exceptional 10.9% |
| Immigrants | Iran | 99.2 /100 | #41 | Exceptional 10.9% |
| Koreans | 99.2 /100 | #42 | Exceptional 10.9% |
| Immigrants | Singapore | 99.2 /100 | #43 | Exceptional 10.9% |
| Immigrants | Moldova | 99.1 /100 | #44 | Exceptional 10.9% |
| Turks | 98.9 /100 | #45 | Exceptional 11.0% |
| Immigrants | Czechoslovakia | 98.9 /100 | #46 | Exceptional 11.0% |
| Immigrants | Romania | 98.9 /100 | #47 | Exceptional 11.0% |
| Slovenes | 98.9 /100 | #48 | Exceptional 11.0% |
| Immigrants | Japan | 98.9 /100 | #49 | Exceptional 11.0% |
| Asians | 98.9 /100 | #50 | Exceptional 11.0% |
| Immigrants | Croatia | 98.7 /100 | #51 | Exceptional 11.0% |
Demographics Similar to Immigrants by Poverty
In terms of poverty, the demographic groups most similar to Immigrants are Immigrants from Panama (13.3%, a difference of 0.13%), Bermudan (13.3%, a difference of 0.39%), Moroccan (13.2%, a difference of 0.45%), Japanese (13.3%, a difference of 0.65%), and Nonimmigrants (13.3%, a difference of 0.65%).
| Demographics | Rating | Rank | Poverty |
| Tsimshian | 9.2 /100 | #205 | Tragic 13.0% |
| Immigrants | Eastern Africa | 7.0 /100 | #206 | Tragic 13.1% |
| Panamanians | 6.6 /100 | #207 | Tragic 13.1% |
| Ugandans | 6.2 /100 | #208 | Tragic 13.1% |
| Malaysians | 6.1 /100 | #209 | Tragic 13.1% |
| Immigrants | Azores | 6.1 /100 | #210 | Tragic 13.1% |
| Moroccans | 5.2 /100 | #211 | Tragic 13.2% |
| Immigrants | Immigrants | 4.3 /100 | #212 | Tragic 13.2% |
| Immigrants | Panama | 4.1 /100 | #213 | Tragic 13.3% |
| Bermudans | 3.7 /100 | #214 | Tragic 13.3% |
| Japanese | 3.3 /100 | #215 | Tragic 13.3% |
| Immigrants | Nonimmigrants | 3.3 /100 | #216 | Tragic 13.3% |
| Immigrants | Uzbekistan | 3.2 /100 | #217 | Tragic 13.3% |
| Immigrants | Thailand | 3.1 /100 | #218 | Tragic 13.3% |
| Immigrants | Cambodia | 3.0 /100 | #219 | Tragic 13.4% |