Immigrants from Moldova vs Swedish Poverty
COMPARE
Immigrants from Moldova
Swedish
Poverty
Poverty Comparison
Immigrants from Moldova
Swedes
10.9%
POVERTY
99.1/ 100
METRIC RATING
44th/ 347
METRIC RANK
10.6%
POVERTY
99.7/ 100
METRIC RATING
23rd/ 347
METRIC RANK
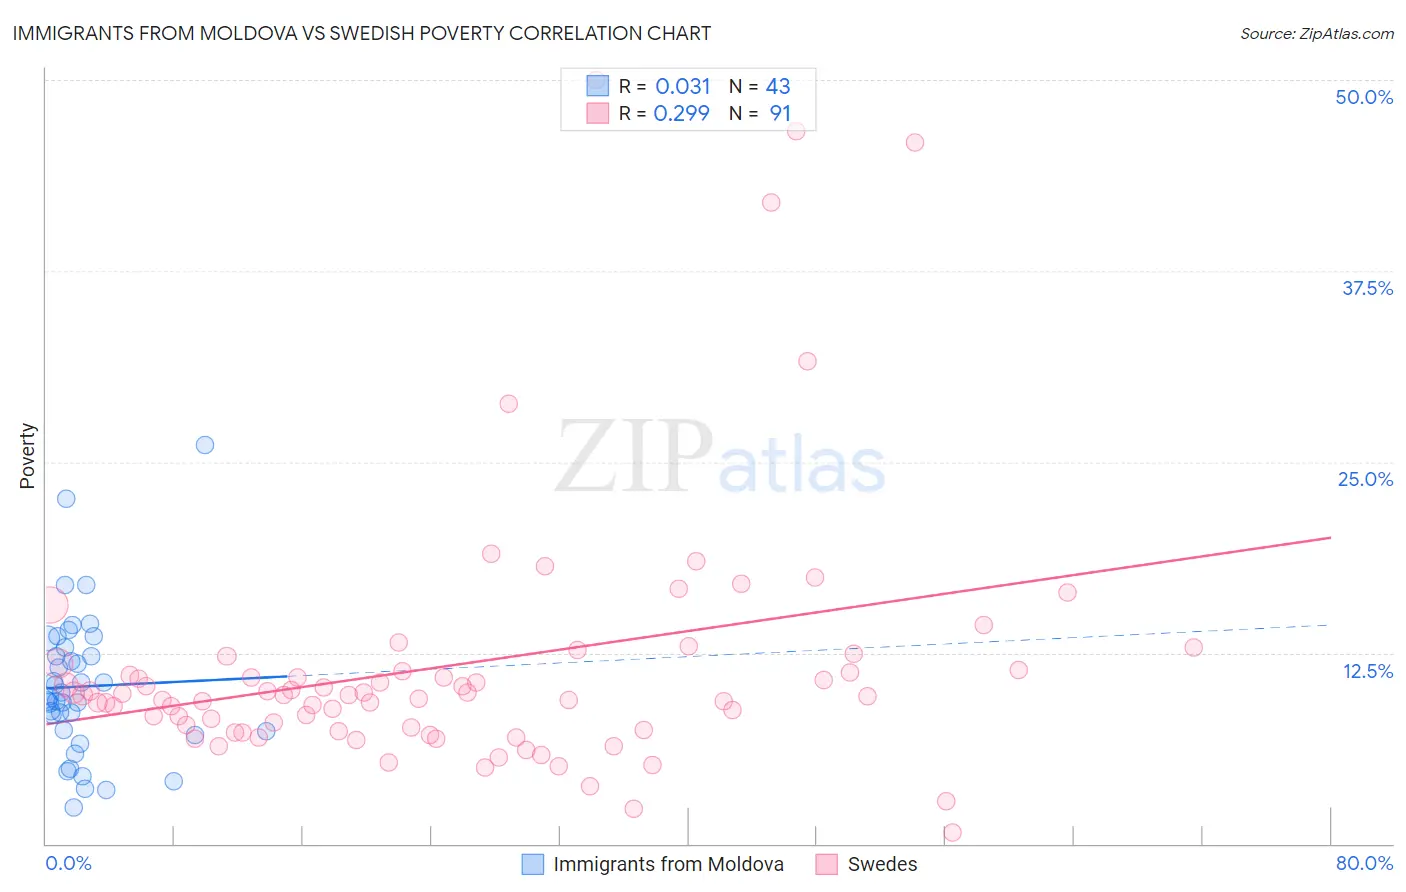
Immigrants from Moldova vs Swedish Poverty Correlation Chart
The statistical analysis conducted on geographies consisting of 124,373,713 people shows no correlation between the proportion of Immigrants from Moldova and poverty level in the United States with a correlation coefficient (R) of 0.031 and weighted average of 10.9%. Similarly, the statistical analysis conducted on geographies consisting of 538,612,277 people shows a weak positive correlation between the proportion of Swedes and poverty level in the United States with a correlation coefficient (R) of 0.299 and weighted average of 10.6%, a difference of 2.8%.
Poverty Correlation Summary
| Measurement | Immigrants from Moldova | Swedish |
| Minimum | 2.4% | 0.75% |
| Maximum | 26.1% | 50.0% |
| Range | 23.7% | 49.2% |
| Mean | 10.3% | 11.7% |
| Median | 9.7% | 9.7% |
| Interquartile 25% (IQ1) | 7.4% | 7.4% |
| Interquartile 75% (IQ3) | 12.9% | 11.4% |
| Interquartile Range (IQR) | 5.5% | 4.0% |
| Standard Deviation (Sample) | 4.8% | 8.7% |
| Standard Deviation (Population) | 4.7% | 8.7% |
Similar Demographics by Poverty
Demographics Similar to Immigrants from Moldova by Poverty
In terms of poverty, the demographic groups most similar to Immigrants from Moldova are Immigrants from Singapore (10.9%, a difference of 0.14%), Korean (10.9%, a difference of 0.19%), Immigrants from Iran (10.9%, a difference of 0.41%), Russian (10.9%, a difference of 0.50%), and Turkish (11.0%, a difference of 0.51%).
| Demographics | Rating | Rank | Poverty |
| Immigrants | Greece | 99.3 /100 | #37 | Exceptional 10.8% |
| Czechs | 99.3 /100 | #38 | Exceptional 10.8% |
| Immigrants | Pakistan | 99.3 /100 | #39 | Exceptional 10.8% |
| Russians | 99.3 /100 | #40 | Exceptional 10.9% |
| Immigrants | Iran | 99.2 /100 | #41 | Exceptional 10.9% |
| Koreans | 99.2 /100 | #42 | Exceptional 10.9% |
| Immigrants | Singapore | 99.2 /100 | #43 | Exceptional 10.9% |
| Immigrants | Moldova | 99.1 /100 | #44 | Exceptional 10.9% |
| Turks | 98.9 /100 | #45 | Exceptional 11.0% |
| Immigrants | Czechoslovakia | 98.9 /100 | #46 | Exceptional 11.0% |
| Immigrants | Romania | 98.9 /100 | #47 | Exceptional 11.0% |
| Slovenes | 98.9 /100 | #48 | Exceptional 11.0% |
| Immigrants | Japan | 98.9 /100 | #49 | Exceptional 11.0% |
| Asians | 98.9 /100 | #50 | Exceptional 11.0% |
| Immigrants | Croatia | 98.7 /100 | #51 | Exceptional 11.0% |
Demographics Similar to Swedes by Poverty
In terms of poverty, the demographic groups most similar to Swedes are Italian (10.6%, a difference of 0.050%), Eastern European (10.6%, a difference of 0.11%), Croatian (10.6%, a difference of 0.24%), Luxembourger (10.6%, a difference of 0.27%), and Immigrants from North Macedonia (10.6%, a difference of 0.34%).
| Demographics | Rating | Rank | Poverty |
| Lithuanians | 99.8 /100 | #16 | Exceptional 10.5% |
| Norwegians | 99.8 /100 | #17 | Exceptional 10.5% |
| Latvians | 99.8 /100 | #18 | Exceptional 10.5% |
| Immigrants | Scotland | 99.7 /100 | #19 | Exceptional 10.6% |
| Immigrants | North Macedonia | 99.7 /100 | #20 | Exceptional 10.6% |
| Luxembourgers | 99.7 /100 | #21 | Exceptional 10.6% |
| Eastern Europeans | 99.7 /100 | #22 | Exceptional 10.6% |
| Swedes | 99.7 /100 | #23 | Exceptional 10.6% |
| Italians | 99.7 /100 | #24 | Exceptional 10.6% |
| Croatians | 99.6 /100 | #25 | Exceptional 10.6% |
| Burmese | 99.6 /100 | #26 | Exceptional 10.7% |
| Immigrants | Northern Europe | 99.6 /100 | #27 | Exceptional 10.7% |
| Immigrants | Korea | 99.5 /100 | #28 | Exceptional 10.7% |
| Greeks | 99.5 /100 | #29 | Exceptional 10.7% |
| Danes | 99.5 /100 | #30 | Exceptional 10.7% |