Immigrants from El Salvador vs Alsatian Female Poverty
COMPARE
Immigrants from El Salvador
Alsatian
Female Poverty
Female Poverty Comparison
Immigrants from El Salvador
Alsatians
15.7%
FEMALE POVERTY
0.1/ 100
METRIC RATING
266th/ 347
METRIC RANK
14.5%
FEMALE POVERTY
4.0/ 100
METRIC RATING
220th/ 347
METRIC RANK
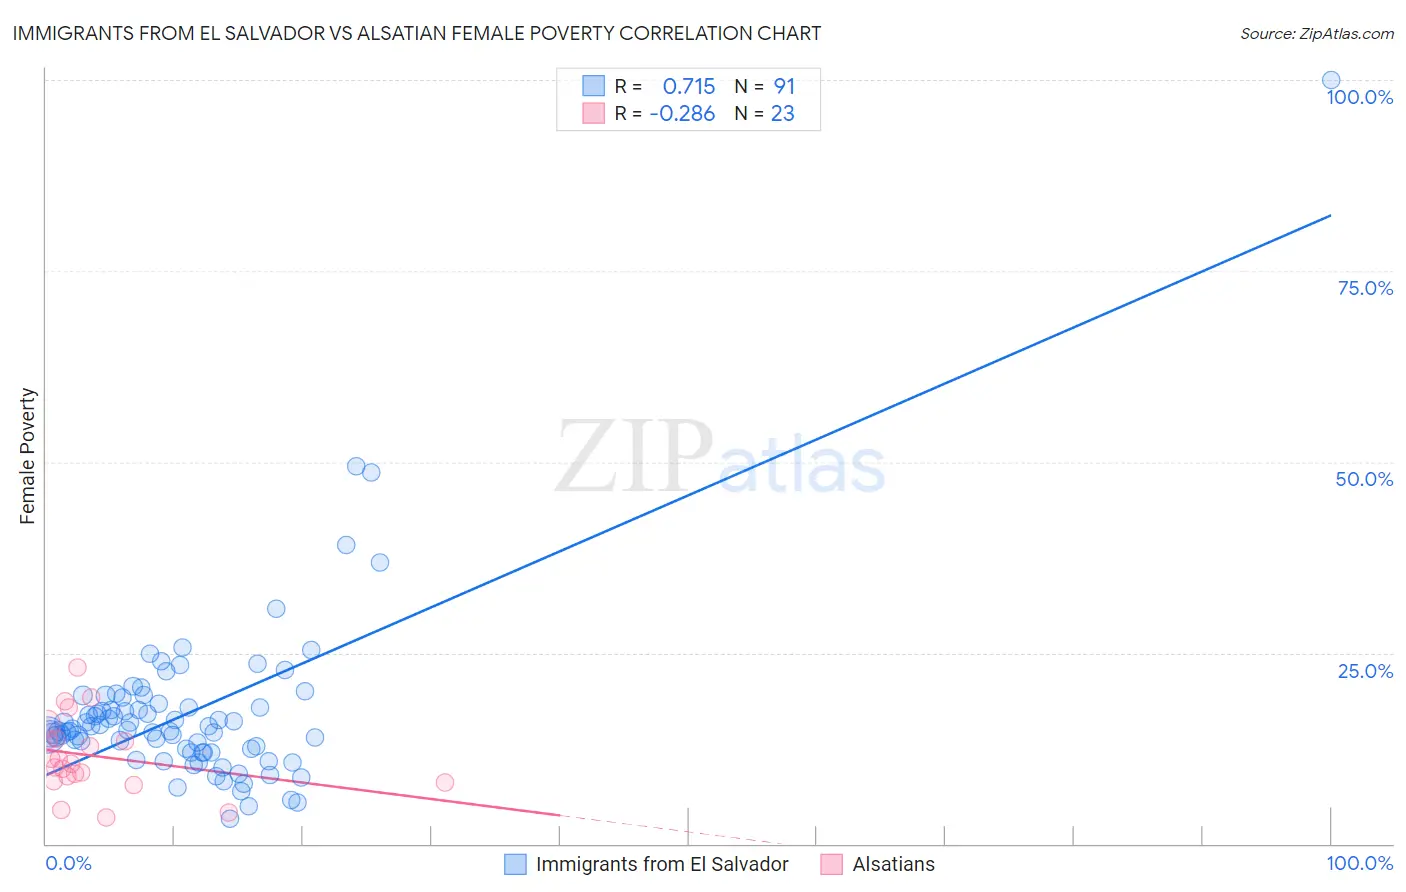
Immigrants from El Salvador vs Alsatian Female Poverty Correlation Chart
The statistical analysis conducted on geographies consisting of 357,675,141 people shows a strong positive correlation between the proportion of Immigrants from El Salvador and poverty level among females in the United States with a correlation coefficient (R) of 0.715 and weighted average of 15.7%. Similarly, the statistical analysis conducted on geographies consisting of 82,678,421 people shows a weak negative correlation between the proportion of Alsatians and poverty level among females in the United States with a correlation coefficient (R) of -0.286 and weighted average of 14.5%, a difference of 8.4%.
Female Poverty Correlation Summary
| Measurement | Immigrants from El Salvador | Alsatian |
| Minimum | 3.3% | 3.4% |
| Maximum | 100.0% | 23.1% |
| Range | 96.7% | 19.7% |
| Mean | 17.2% | 11.5% |
| Median | 14.8% | 10.5% |
| Interquartile 25% (IQ1) | 12.0% | 8.2% |
| Interquartile 75% (IQ3) | 18.3% | 13.7% |
| Interquartile Range (IQR) | 6.3% | 5.5% |
| Standard Deviation (Sample) | 11.7% | 5.0% |
| Standard Deviation (Population) | 11.6% | 4.9% |
Similar Demographics by Female Poverty
Demographics Similar to Immigrants from El Salvador by Female Poverty
In terms of female poverty, the demographic groups most similar to Immigrants from El Salvador are Immigrants from Liberia (15.7%, a difference of 0.060%), Immigrants from Ecuador (15.6%, a difference of 0.36%), Subsaharan African (15.8%, a difference of 0.43%), Cherokee (15.6%, a difference of 0.49%), and Immigrants from Nicaragua (15.8%, a difference of 0.49%).
| Demographics | Rating | Rank | Female Poverty |
| Cape Verdeans | 0.1 /100 | #259 | Tragic 15.6% |
| Immigrants | Guyana | 0.1 /100 | #260 | Tragic 15.6% |
| Guyanese | 0.1 /100 | #261 | Tragic 15.6% |
| Mexican American Indians | 0.1 /100 | #262 | Tragic 15.6% |
| Cherokee | 0.1 /100 | #263 | Tragic 15.6% |
| Immigrants | Ecuador | 0.1 /100 | #264 | Tragic 15.6% |
| Immigrants | Liberia | 0.1 /100 | #265 | Tragic 15.7% |
| Immigrants | El Salvador | 0.1 /100 | #266 | Tragic 15.7% |
| Sub-Saharan Africans | 0.1 /100 | #267 | Tragic 15.8% |
| Immigrants | Nicaragua | 0.1 /100 | #268 | Tragic 15.8% |
| Iroquois | 0.1 /100 | #269 | Tragic 15.8% |
| Chickasaw | 0.1 /100 | #270 | Tragic 15.9% |
| Immigrants | St. Vincent and the Grenadines | 0.0 /100 | #271 | Tragic 15.9% |
| Belizeans | 0.0 /100 | #272 | Tragic 15.9% |
| Haitians | 0.0 /100 | #273 | Tragic 15.9% |
Demographics Similar to Alsatians by Female Poverty
In terms of female poverty, the demographic groups most similar to Alsatians are Japanese (14.5%, a difference of 0.050%), Immigrants from Uzbekistan (14.4%, a difference of 0.18%), Immigrants from Cambodia (14.5%, a difference of 0.19%), Nonimmigrants (14.5%, a difference of 0.22%), and Immigrants (14.4%, a difference of 0.23%).
| Demographics | Rating | Rank | Female Poverty |
| Alaskan Athabascans | 5.3 /100 | #213 | Tragic 14.4% |
| Marshallese | 5.0 /100 | #214 | Tragic 14.4% |
| Immigrants | Panama | 4.7 /100 | #215 | Tragic 14.4% |
| Immigrants | Thailand | 4.5 /100 | #216 | Tragic 14.4% |
| Immigrants | Immigrants | 4.5 /100 | #217 | Tragic 14.4% |
| Immigrants | Uzbekistan | 4.4 /100 | #218 | Tragic 14.4% |
| Japanese | 4.1 /100 | #219 | Tragic 14.5% |
| Alsatians | 4.0 /100 | #220 | Tragic 14.5% |
| Immigrants | Cambodia | 3.7 /100 | #221 | Tragic 14.5% |
| Immigrants | Nonimmigrants | 3.7 /100 | #222 | Tragic 14.5% |
| Immigrants | Africa | 3.3 /100 | #223 | Tragic 14.5% |
| Americans | 2.8 /100 | #224 | Tragic 14.6% |
| Immigrants | Micronesia | 2.8 /100 | #225 | Tragic 14.6% |
| Immigrants | Eritrea | 2.4 /100 | #226 | Tragic 14.6% |
| Immigrants | Nigeria | 2.1 /100 | #227 | Tragic 14.7% |