Immigrants from Nigeria vs Alsatian Female Poverty
COMPARE
Immigrants from Nigeria
Alsatian
Female Poverty
Female Poverty Comparison
Immigrants from Nigeria
Alsatians
14.7%
FEMALE POVERTY
2.1/ 100
METRIC RATING
227th/ 347
METRIC RANK
14.5%
FEMALE POVERTY
4.0/ 100
METRIC RATING
220th/ 347
METRIC RANK
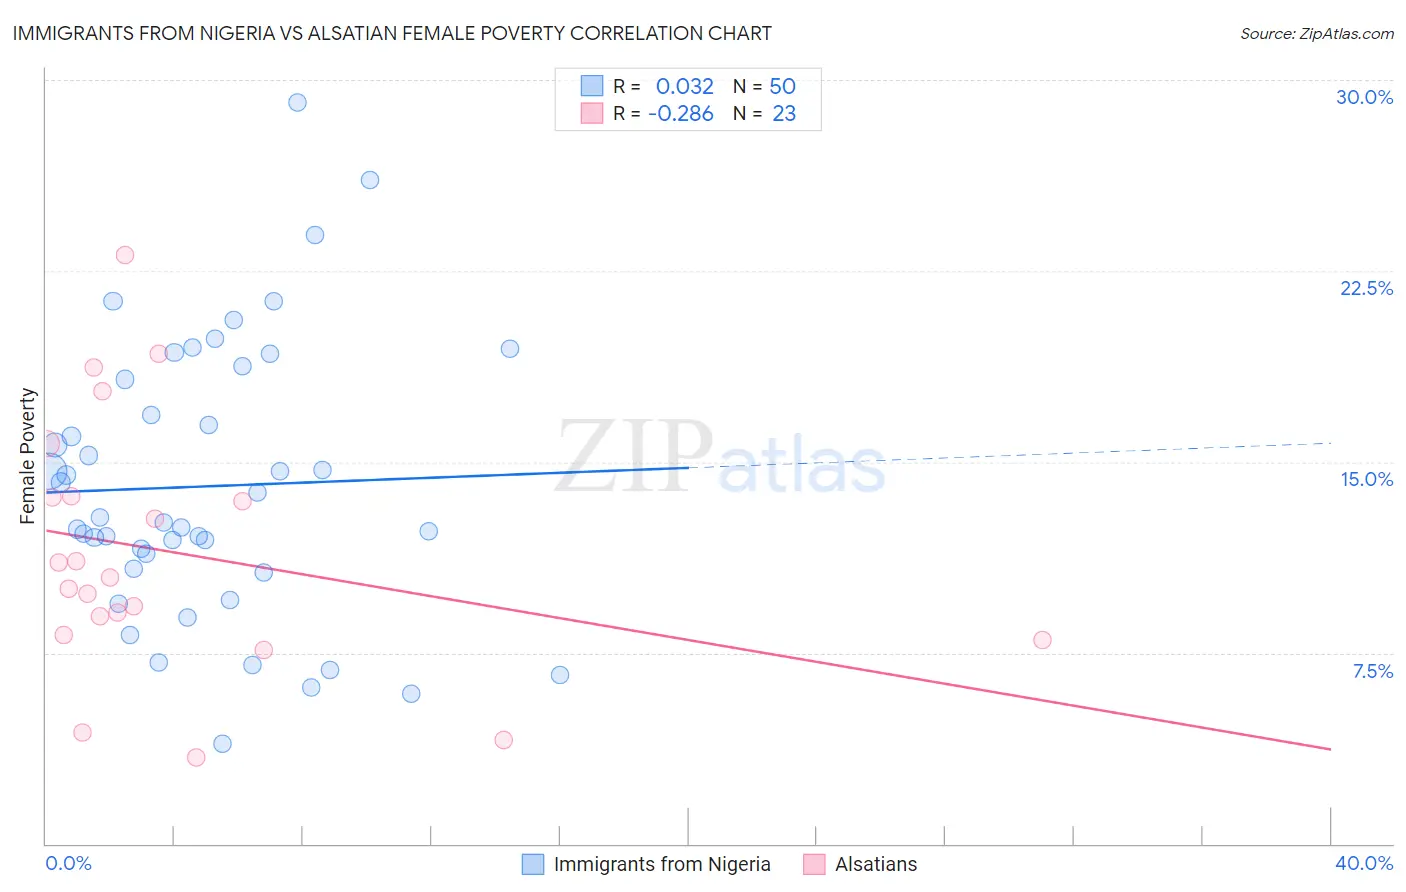
Immigrants from Nigeria vs Alsatian Female Poverty Correlation Chart
The statistical analysis conducted on geographies consisting of 283,264,818 people shows no correlation between the proportion of Immigrants from Nigeria and poverty level among females in the United States with a correlation coefficient (R) of 0.032 and weighted average of 14.7%. Similarly, the statistical analysis conducted on geographies consisting of 82,678,421 people shows a weak negative correlation between the proportion of Alsatians and poverty level among females in the United States with a correlation coefficient (R) of -0.286 and weighted average of 14.5%, a difference of 1.5%.
Female Poverty Correlation Summary
| Measurement | Immigrants from Nigeria | Alsatian |
| Minimum | 3.9% | 3.4% |
| Maximum | 29.1% | 23.1% |
| Range | 25.2% | 19.7% |
| Mean | 14.0% | 11.5% |
| Median | 12.7% | 10.5% |
| Interquartile 25% (IQ1) | 10.8% | 8.2% |
| Interquartile 75% (IQ3) | 18.2% | 13.7% |
| Interquartile Range (IQR) | 7.4% | 5.5% |
| Standard Deviation (Sample) | 5.4% | 5.0% |
| Standard Deviation (Population) | 5.4% | 4.9% |
Demographics Similar to Immigrants from Nigeria and Alsatians by Female Poverty
In terms of female poverty, the demographic groups most similar to Immigrants from Nigeria are German Russian (14.7%, a difference of 0.15%), Ghanaian (14.7%, a difference of 0.21%), Immigrants from Eritrea (14.6%, a difference of 0.31%), Alaska Native (14.7%, a difference of 0.41%), and Nigerian (14.8%, a difference of 0.51%). Similarly, the demographic groups most similar to Alsatians are Japanese (14.5%, a difference of 0.050%), Immigrants from Uzbekistan (14.4%, a difference of 0.18%), Immigrants from Cambodia (14.5%, a difference of 0.19%), Nonimmigrants (14.5%, a difference of 0.22%), and Immigrants (14.4%, a difference of 0.23%).
| Demographics | Rating | Rank | Female Poverty |
| Alaskan Athabascans | 5.3 /100 | #213 | Tragic 14.4% |
| Marshallese | 5.0 /100 | #214 | Tragic 14.4% |
| Immigrants | Panama | 4.7 /100 | #215 | Tragic 14.4% |
| Immigrants | Thailand | 4.5 /100 | #216 | Tragic 14.4% |
| Immigrants | Immigrants | 4.5 /100 | #217 | Tragic 14.4% |
| Immigrants | Uzbekistan | 4.4 /100 | #218 | Tragic 14.4% |
| Japanese | 4.1 /100 | #219 | Tragic 14.5% |
| Alsatians | 4.0 /100 | #220 | Tragic 14.5% |
| Immigrants | Cambodia | 3.7 /100 | #221 | Tragic 14.5% |
| Immigrants | Nonimmigrants | 3.7 /100 | #222 | Tragic 14.5% |
| Immigrants | Africa | 3.3 /100 | #223 | Tragic 14.5% |
| Americans | 2.8 /100 | #224 | Tragic 14.6% |
| Immigrants | Micronesia | 2.8 /100 | #225 | Tragic 14.6% |
| Immigrants | Eritrea | 2.4 /100 | #226 | Tragic 14.6% |
| Immigrants | Nigeria | 2.1 /100 | #227 | Tragic 14.7% |
| German Russians | 2.0 /100 | #228 | Tragic 14.7% |
| Ghanaians | 1.9 /100 | #229 | Tragic 14.7% |
| Alaska Natives | 1.8 /100 | #230 | Tragic 14.7% |
| Nigerians | 1.7 /100 | #231 | Tragic 14.8% |
| Osage | 1.5 /100 | #232 | Tragic 14.8% |
| Immigrants | Saudi Arabia | 1.4 /100 | #233 | Tragic 14.8% |