Immigrants from Micronesia vs Carpatho Rusyn Poverty
COMPARE
Immigrants from Micronesia
Carpatho Rusyn
Poverty
Poverty Comparison
Immigrants from Micronesia
Carpatho Rusyns
13.4%
POVERTY
2.6/ 100
METRIC RATING
222nd/ 347
METRIC RANK
11.3%
POVERTY
97.2/ 100
METRIC RATING
74th/ 347
METRIC RANK
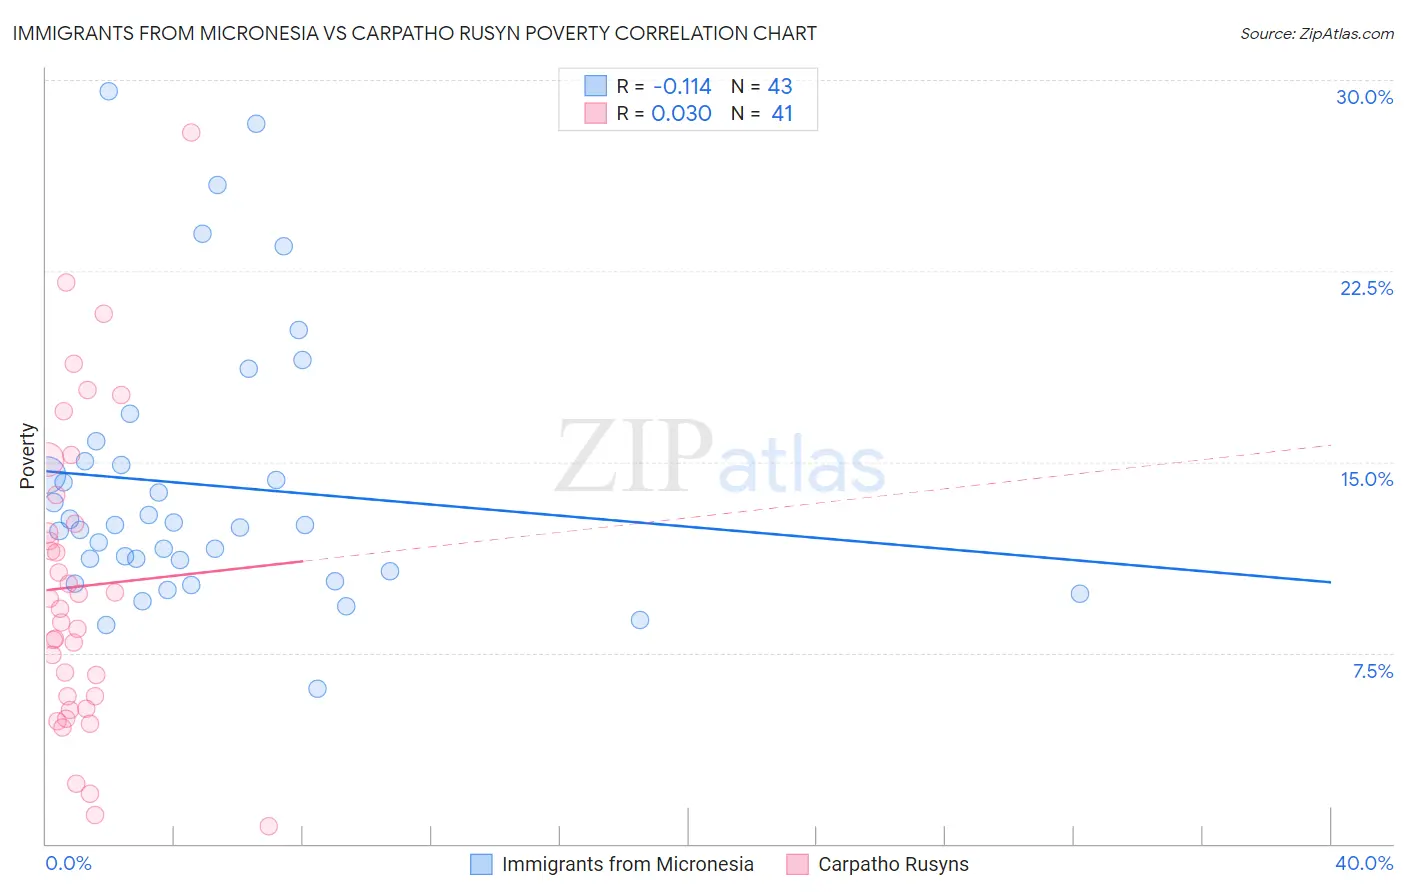
Immigrants from Micronesia vs Carpatho Rusyn Poverty Correlation Chart
The statistical analysis conducted on geographies consisting of 61,600,869 people shows a poor negative correlation between the proportion of Immigrants from Micronesia and poverty level in the United States with a correlation coefficient (R) of -0.114 and weighted average of 13.4%. Similarly, the statistical analysis conducted on geographies consisting of 58,869,628 people shows no correlation between the proportion of Carpatho Rusyns and poverty level in the United States with a correlation coefficient (R) of 0.030 and weighted average of 11.3%, a difference of 19.0%.
Poverty Correlation Summary
| Measurement | Immigrants from Micronesia | Carpatho Rusyn |
| Minimum | 6.1% | 0.68% |
| Maximum | 29.6% | 27.9% |
| Range | 23.5% | 27.2% |
| Mean | 14.1% | 10.1% |
| Median | 12.5% | 9.2% |
| Interquartile 25% (IQ1) | 10.7% | 5.6% |
| Interquartile 75% (IQ3) | 15.0% | 13.1% |
| Interquartile Range (IQR) | 4.4% | 7.6% |
| Standard Deviation (Sample) | 5.3% | 6.0% |
| Standard Deviation (Population) | 5.3% | 5.9% |
Similar Demographics by Poverty
Demographics Similar to Immigrants from Micronesia by Poverty
In terms of poverty, the demographic groups most similar to Immigrants from Micronesia are Alsatian (13.4%, a difference of 0.040%), Immigrants from Africa (13.4%, a difference of 0.040%), Immigrants from Eritrea (13.4%, a difference of 0.14%), American (13.4%, a difference of 0.24%), and Immigrants from Cambodia (13.4%, a difference of 0.33%).
| Demographics | Rating | Rank | Poverty |
| Japanese | 3.3 /100 | #215 | Tragic 13.3% |
| Immigrants | Nonimmigrants | 3.3 /100 | #216 | Tragic 13.3% |
| Immigrants | Uzbekistan | 3.2 /100 | #217 | Tragic 13.3% |
| Immigrants | Thailand | 3.1 /100 | #218 | Tragic 13.3% |
| Immigrants | Cambodia | 3.0 /100 | #219 | Tragic 13.4% |
| Americans | 2.9 /100 | #220 | Tragic 13.4% |
| Alsatians | 2.6 /100 | #221 | Tragic 13.4% |
| Immigrants | Micronesia | 2.6 /100 | #222 | Tragic 13.4% |
| Immigrants | Africa | 2.5 /100 | #223 | Tragic 13.4% |
| Immigrants | Eritrea | 2.4 /100 | #224 | Tragic 13.4% |
| German Russians | 2.2 /100 | #225 | Tragic 13.4% |
| Marshallese | 2.2 /100 | #226 | Tragic 13.4% |
| Alaska Natives | 2.1 /100 | #227 | Tragic 13.5% |
| Immigrants | Nigeria | 1.7 /100 | #228 | Tragic 13.5% |
| Osage | 1.5 /100 | #229 | Tragic 13.6% |
Demographics Similar to Carpatho Rusyns by Poverty
In terms of poverty, the demographic groups most similar to Carpatho Rusyns are European (11.3%, a difference of 0.050%), Immigrants from Belgium (11.3%, a difference of 0.050%), Zimbabwean (11.3%, a difference of 0.070%), Immigrants from Canada (11.3%, a difference of 0.090%), and Serbian (11.2%, a difference of 0.18%).
| Demographics | Rating | Rank | Poverty |
| Immigrants | Australia | 97.4 /100 | #67 | Exceptional 11.2% |
| Slovaks | 97.4 /100 | #68 | Exceptional 11.2% |
| Serbians | 97.4 /100 | #69 | Exceptional 11.2% |
| Immigrants | Canada | 97.3 /100 | #70 | Exceptional 11.3% |
| Zimbabweans | 97.3 /100 | #71 | Exceptional 11.3% |
| Europeans | 97.2 /100 | #72 | Exceptional 11.3% |
| Immigrants | Belgium | 97.2 /100 | #73 | Exceptional 11.3% |
| Carpatho Rusyns | 97.2 /100 | #74 | Exceptional 11.3% |
| Immigrants | Eastern Europe | 97.0 /100 | #75 | Exceptional 11.3% |
| Immigrants | North America | 96.8 /100 | #76 | Exceptional 11.3% |
| Immigrants | Eastern Asia | 96.7 /100 | #77 | Exceptional 11.3% |
| Dutch | 96.7 /100 | #78 | Exceptional 11.3% |
| Cambodians | 96.7 /100 | #79 | Exceptional 11.3% |
| Indians (Asian) | 96.6 /100 | #80 | Exceptional 11.3% |
| Irish | 96.6 /100 | #81 | Exceptional 11.3% |