Immigrants from Micronesia vs Ghanaian Poverty
COMPARE
Immigrants from Micronesia
Ghanaian
Poverty
Poverty Comparison
Immigrants from Micronesia
Ghanaians
13.4%
POVERTY
2.6/ 100
METRIC RATING
222nd/ 347
METRIC RANK
13.9%
POVERTY
0.5/ 100
METRIC RATING
238th/ 347
METRIC RANK
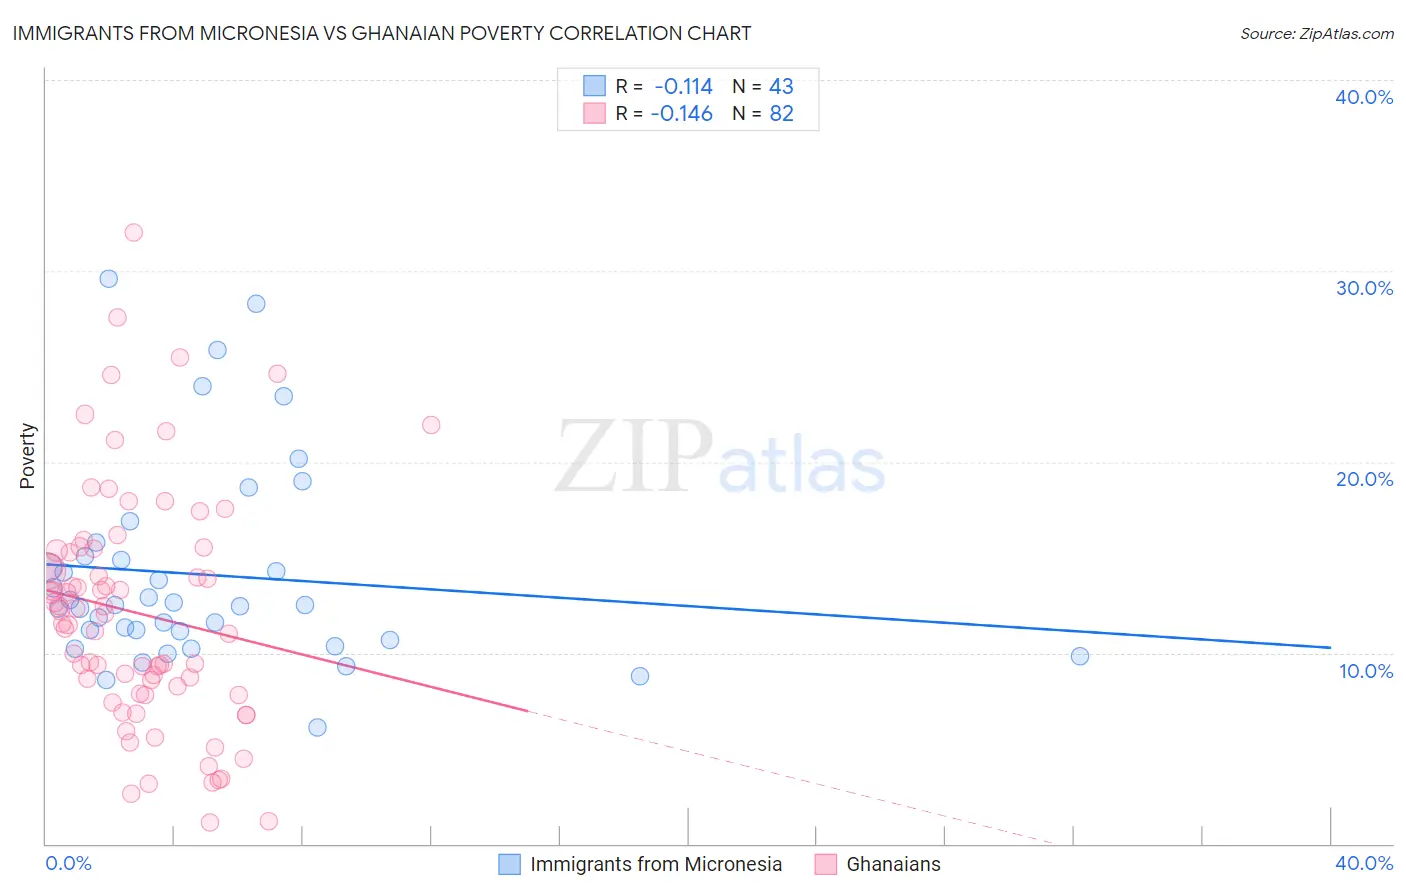
Immigrants from Micronesia vs Ghanaian Poverty Correlation Chart
The statistical analysis conducted on geographies consisting of 61,600,869 people shows a poor negative correlation between the proportion of Immigrants from Micronesia and poverty level in the United States with a correlation coefficient (R) of -0.114 and weighted average of 13.4%. Similarly, the statistical analysis conducted on geographies consisting of 190,556,077 people shows a poor negative correlation between the proportion of Ghanaians and poverty level in the United States with a correlation coefficient (R) of -0.146 and weighted average of 13.9%, a difference of 3.7%.
Poverty Correlation Summary
| Measurement | Immigrants from Micronesia | Ghanaian |
| Minimum | 6.1% | 1.1% |
| Maximum | 29.6% | 32.0% |
| Range | 23.5% | 30.9% |
| Mean | 14.1% | 12.1% |
| Median | 12.5% | 11.8% |
| Interquartile 25% (IQ1) | 10.7% | 7.9% |
| Interquartile 75% (IQ3) | 15.0% | 15.4% |
| Interquartile Range (IQR) | 4.4% | 7.5% |
| Standard Deviation (Sample) | 5.3% | 6.2% |
| Standard Deviation (Population) | 5.3% | 6.2% |
Demographics Similar to Immigrants from Micronesia and Ghanaians by Poverty
In terms of poverty, the demographic groups most similar to Immigrants from Micronesia are Alsatian (13.4%, a difference of 0.040%), Immigrants from Africa (13.4%, a difference of 0.040%), Immigrants from Eritrea (13.4%, a difference of 0.14%), American (13.4%, a difference of 0.24%), and German Russian (13.4%, a difference of 0.35%). Similarly, the demographic groups most similar to Ghanaians are French American Indian (13.9%, a difference of 0.13%), Immigrants from Armenia (13.9%, a difference of 0.15%), Cuban (13.9%, a difference of 0.19%), Nicaraguan (13.9%, a difference of 0.35%), and Immigrants from Middle Africa (14.0%, a difference of 0.47%).
| Demographics | Rating | Rank | Poverty |
| Americans | 2.9 /100 | #220 | Tragic 13.4% |
| Alsatians | 2.6 /100 | #221 | Tragic 13.4% |
| Immigrants | Micronesia | 2.6 /100 | #222 | Tragic 13.4% |
| Immigrants | Africa | 2.5 /100 | #223 | Tragic 13.4% |
| Immigrants | Eritrea | 2.4 /100 | #224 | Tragic 13.4% |
| German Russians | 2.2 /100 | #225 | Tragic 13.4% |
| Marshallese | 2.2 /100 | #226 | Tragic 13.4% |
| Alaska Natives | 2.1 /100 | #227 | Tragic 13.5% |
| Immigrants | Nigeria | 1.7 /100 | #228 | Tragic 13.5% |
| Osage | 1.5 /100 | #229 | Tragic 13.6% |
| Alaskan Athabascans | 1.5 /100 | #230 | Tragic 13.6% |
| Nigerians | 1.4 /100 | #231 | Tragic 13.6% |
| Fijians | 0.8 /100 | #232 | Tragic 13.7% |
| Immigrants | Saudi Arabia | 0.8 /100 | #233 | Tragic 13.8% |
| Immigrants | Laos | 0.7 /100 | #234 | Tragic 13.8% |
| Cubans | 0.6 /100 | #235 | Tragic 13.9% |
| Immigrants | Armenia | 0.5 /100 | #236 | Tragic 13.9% |
| French American Indians | 0.5 /100 | #237 | Tragic 13.9% |
| Ghanaians | 0.5 /100 | #238 | Tragic 13.9% |
| Nicaraguans | 0.4 /100 | #239 | Tragic 13.9% |
| Immigrants | Middle Africa | 0.4 /100 | #240 | Tragic 14.0% |