Immigrants from Micronesia vs Carpatho Rusyn Disability Age 65 to 74

COMPARE

Immigrants from Micronesia
Race
Ancestry
AfghanAfricanAlaska NativeAlaskan AthabascanAlbanianAleutAlsatianAmericanApacheArabArapahoArgentineanArmenianAssyrian/Chaldean/SyriacAustralianAustrianBahamianBangladeshiBarbadianBasqueBelgianBelizeanBermudanBhutaneseBlackfeetBolivianBrazilianBritishBritish West IndianBulgarianBurmeseCajunCambodianCanadianCape VerdeanCelticCentral AmericanCentral American IndianCherokeeCheyenneChickasawChileanChineseChippewaChoctawColombianColvilleComancheCosta RicanCreeCreekCroatianCrowCubanCypriotCzechCzechoslovakianDanishDelawareDominicanDutchDutch West IndianEastern EuropeanEcuadorianEgyptianEnglishEstonianEthiopianEuropeanFijianFilipinoFinnishFrenchFrench American IndianFrench CanadianGermanGerman RussianGhanaianGreekGuamanian/ChamorroGuatemalanGuyaneseHaitianHmongHonduranHopiHoumaHungarianIcelanderIndian (Asian)IndonesianInupiatIranianIraqiIrishIroquoisIsraeliItalianJamaicanJapaneseJordanianKenyanKiowaKoreanLaotianLatvianLebaneseLiberianLithuanianLumbeeLuxembourgerMacedonianMalaysianMalteseMarshalleseMenomineeMexicanMexican American IndianMongolianMoroccanNative HawaiianNavajoNepaleseNew ZealanderNicaraguanNigerianNorthern EuropeanNorwegianOkinawanOsageOttawaPaiutePakistaniPalestinianPanamanianParaguayanPennsylvania GermanPeruvianPimaPolishPortuguesePotawatomiPuebloPuerto RicanPuget Sound SalishRomanianRussianSalvadoranSamoanScandinavianScotch-IrishScottishSeminoleSenegaleseSerbianShoshoneSierra LeoneanSiouxSlavicSlovakSloveneSomaliSouth AfricanSouth AmericanSouth American IndianSoviet UnionSpaniardSpanishSpanish AmericanSpanish American IndianSri LankanSubsaharan AfricanSudaneseSwedishSwissSyrianTaiwaneseThaiTlingit-HaidaTohono O'OdhamTonganTrinidadian and TobagonianTsimshianTurkishU.S. Virgin IslanderUgandanUkrainianUruguayanUteVenezuelanVietnameseWelshWest IndianYakamaYaquiYugoslavianYumanYup'ikZimbabwean
Immigration
NonimmigrantsImmigrantsAfghanistanAfricaAlbaniaArgentinaArmeniaAsiaAustraliaAustriaBahamasBangladeshBarbadosBelarusBelgiumBelizeBoliviaBosnia and HerzegovinaBrazilBulgariaBurma/MyanmarCabo VerdeCambodiaCameroonCanadaCaribbeanCentral AmericaChileChinaColombiaCongoCosta RicaCroatiaCubaCzechoslovakiaDenmarkDominicaDominican RepublicEastern AfricaEastern AsiaEastern EuropeEcuadorEgyptEl SalvadorEnglandEritreaEthiopiaEuropeFijiFranceGermanyGhanaGreeceGrenadaGuatemalaGuyanaHaitiHondurasHong KongHungaryIndiaIndonesiaIranIraqIrelandIsraelItalyJamaicaJapanJordanKazakhstanKenyaKoreaKuwaitLaosLatin AmericaLatviaLebanonLiberiaLithuaniaMalaysiaMexicoMicronesiaMiddle AfricaMoldovaMoroccoNepalNetherlandsNicaraguaNigeriaNorth AmericaNorth MacedoniaNorthern AfricaNorthern EuropeNorwayOceaniaPakistanPanamaPeruPhilippinesPolandPortugalRomaniaRussiaSaudi ArabiaScotlandSenegalSerbiaSierra LeoneSingaporeSomaliaSouth AfricaSouth AmericaSouth Central AsiaSouth Eastern AsiaSouthern EuropeSpainSri LankaSt. Vincent and the GrenadinesSudanSwedenSwitzerlandSyriaTaiwanThailandTrinidad and TobagoTurkeyUgandaUkraineUruguayUzbekistanVenezuelaVietnamWest IndiesWestern AfricaWestern AsiaWestern EuropeYemenZaireZimbabweAzores
Carpatho Rusyn
Race
Ancestry
AfghanAfricanAlaska NativeAlaskan AthabascanAlbanianAleutAlsatianAmericanApacheArabArapahoArgentineanArmenianAssyrian/Chaldean/SyriacAustralianAustrianBahamianBangladeshiBarbadianBasqueBelgianBelizeanBermudanBhutaneseBlackfeetBolivianBrazilianBritishBritish West IndianBulgarianBurmeseCajunCambodianCanadianCape VerdeanCarpatho RusynCelticCentral AmericanCentral American IndianCherokeeCheyenneChickasawChileanChineseChippewaChoctawColombianColvilleComancheCosta RicanCreeCreekCroatianCrowCubanCypriotCzechCzechoslovakianDanishDelawareDominicanDutchDutch West IndianEastern EuropeanEcuadorianEgyptianEnglishEstonianEthiopianEuropeanFijianFilipinoFinnishFrenchFrench American IndianFrench CanadianGermanGerman RussianGhanaianGreekGuamanian/ChamorroGuatemalanGuyaneseHaitianHmongHonduranHopiHoumaHungarianIcelanderIndian (Asian)IndonesianInupiatIranianIraqiIrishIroquoisIsraeliItalianJamaicanJapaneseJordanianKenyanKiowaKoreanLaotianLatvianLebaneseLiberianLithuanianLumbeeLuxembourgerMacedonianMalaysianMalteseMarshalleseMenomineeMexicanMexican American IndianMongolianMoroccanNative HawaiianNavajoNepaleseNew ZealanderNicaraguanNigerianNorthern EuropeanNorwegianOkinawanOsageOttawaPaiutePakistaniPalestinianPanamanianParaguayanPennsylvania GermanPeruvianPimaPolishPortuguesePotawatomiPuebloPuerto RicanPuget Sound SalishRomanianRussianSalvadoranSamoanScandinavianScotch-IrishScottishSeminoleSenegaleseSerbianShoshoneSierra LeoneanSiouxSlavicSlovakSloveneSomaliSouth AfricanSouth AmericanSouth American IndianSoviet UnionSpaniardSpanishSpanish AmericanSpanish American IndianSri LankanSubsaharan AfricanSudaneseSwedishSwissSyrianTaiwaneseThaiTlingit-HaidaTohono O'OdhamTonganTrinidadian and TobagonianTsimshianTurkishU.S. Virgin IslanderUgandanUkrainianUruguayanUteVenezuelanVietnameseWelshWest IndianYakamaYaquiYugoslavianYumanYup'ikZimbabwean
Immigration
NonimmigrantsImmigrantsAfghanistanAfricaAlbaniaArgentinaArmeniaAsiaAustraliaAustriaBahamasBangladeshBarbadosBelarusBelgiumBelizeBoliviaBosnia and HerzegovinaBrazilBulgariaBurma/MyanmarCabo VerdeCambodiaCameroonCanadaCaribbeanCentral AmericaChileChinaColombiaCongoCosta RicaCroatiaCubaCzechoslovakiaDenmarkDominicaDominican RepublicEastern AfricaEastern AsiaEastern EuropeEcuadorEgyptEl SalvadorEnglandEritreaEthiopiaEuropeFijiFranceGermanyGhanaGreeceGrenadaGuatemalaGuyanaHaitiHondurasHong KongHungaryIndiaIndonesiaIranIraqIrelandIsraelItalyJamaicaJapanJordanKazakhstanKenyaKoreaKuwaitLaosLatin AmericaLatviaLebanonLiberiaLithuaniaMalaysiaMexicoMiddle AfricaMoldovaMoroccoNepalNetherlandsNicaraguaNigeriaNorth AmericaNorth MacedoniaNorthern AfricaNorthern EuropeNorwayOceaniaPakistanPanamaPeruPhilippinesPolandPortugalRomaniaRussiaSaudi ArabiaScotlandSenegalSerbiaSierra LeoneSingaporeSomaliaSouth AfricaSouth AmericaSouth Central AsiaSouth Eastern AsiaSouthern EuropeSpainSri LankaSt. Vincent and the GrenadinesSudanSwedenSwitzerlandSyriaTaiwanThailandTrinidad and TobagoTurkeyUgandaUkraineUruguayUzbekistanVenezuelaVietnamWest IndiesWestern AfricaWestern AsiaWestern EuropeYemenZaireZimbabweAzores
Disability Age 65 to 74
Income
Poverty
Unemployment
Labor Participation
Family Structure
Vehicle Availability
Education Level
Disability

Disability Age 65 to 74 Comparison

Immigrants from Micronesia

Carpatho Rusyns

Tragic
Exceptional
26.1%
DISABILITY AGE 65 TO 74
0.0/ 100
METRIC RATING
286th/ 347
METRIC RANK
21.6%
DISABILITY AGE 65 TO 74
99.5/ 100
METRIC RATING
62nd/ 347
METRIC RANK

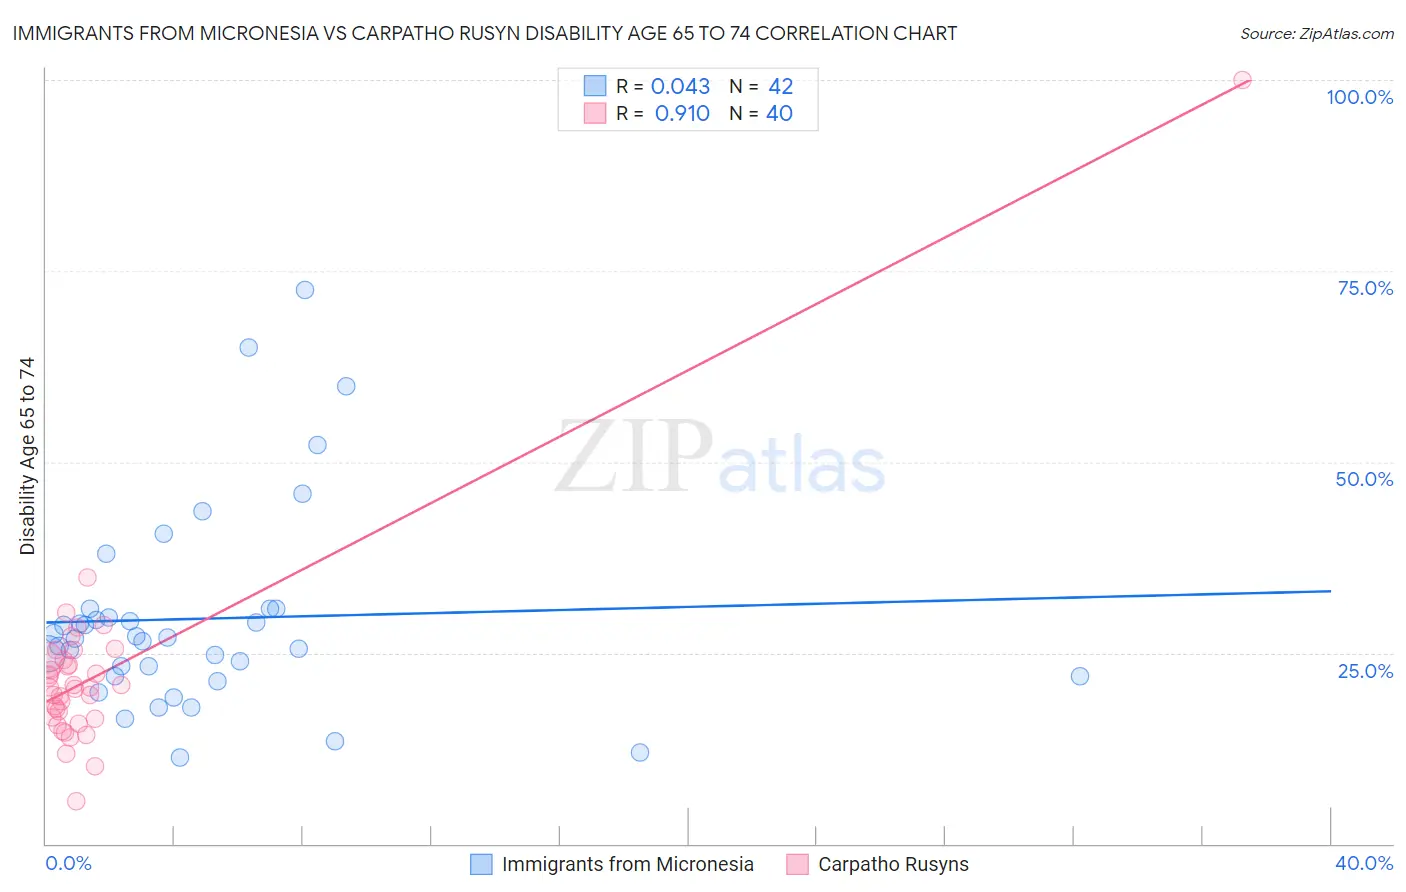
Immigrants from Micronesia vs Carpatho Rusyn Disability Age 65 to 74 Correlation Chart

The statistical analysis conducted on geographies consisting of 61,452,747 people shows no correlation between the proportion of Immigrants from Micronesia and percentage of population with a disability between the ages 65 and 75 in the United States with a correlation coefficient (R) of 0.043 and weighted average of 26.1%. Similarly, the statistical analysis conducted on geographies consisting of 58,867,646 people shows a near-perfect positive correlation between the proportion of Carpatho Rusyns and percentage of population with a disability between the ages 65 and 75 in the United States with a correlation coefficient (R) of 0.910 and weighted average of 21.6%, a difference of 21.1%.
Immigrants from Micronesia vs Carpatho Rusyn Disability Age 65 to 74

Disability Age 65 to 74 Correlation Summary

MeasurementImmigrants from MicronesiaCarpatho Rusyn
Minimum11.3%5.6%
Maximum72.4%100.0%
Range61.1%94.4%
Mean29.5%22.3%
Median27.0%20.5%
Interquartile 25% (IQ1)22.0%16.5%
Interquartile 75% (IQ3)30.8%24.0%
Interquartile Range (IQR)8.8%7.6%
Standard Deviation (Sample)13.2%13.8%
Standard Deviation (Population)13.1%13.7%

Similar Demographics by Disability Age 65 to 74

Demographics Similar to Immigrants from Micronesia by Disability Age 65 to 74

In terms of disability age 65 to 74, the demographic groups most similar to Immigrants from Micronesia are Immigrants from Laos (26.1%, a difference of 0.070%), Mexican American Indian (26.2%, a difference of 0.16%), Immigrants from Congo (26.0%, a difference of 0.43%), Immigrants from the Azores (26.0%, a difference of 0.44%), and African (26.2%, a difference of 0.48%).
DemographicsRating | RankDisability Age 65 to 74
U.S. Virgin Islanders
0.1
/100
|
#279
Tragic
25.9%
Cree
0.1
/100
|
#280
Tragic
25.9%
Immigrants | Honduras
0.1
/100
|
#281
Tragic
25.9%
Delaware
0.1
/100
|
#282
Tragic
25.9%
Spanish Americans
0.0
/100
|
#283
Tragic
25.9%
Immigrants | Azores
0.0
/100
|
#284
Tragic
26.0%
Immigrants | Congo
0.0
/100
|
#285
Tragic
26.0%
Immigrants | Micronesia
0.0
/100
|
#286
Tragic
26.1%
Immigrants | Laos
0.0
/100
|
#287
Tragic
26.1%
Mexican American Indians
0.0
/100
|
#288
Tragic
26.2%
Africans
0.0
/100
|
#289
Tragic
26.2%
Immigrants | Cabo Verde
0.0
/100
|
#290
Tragic
26.3%
Spanish American Indians
0.0
/100
|
#291
Tragic
26.4%
Blackfeet
0.0
/100
|
#292
Tragic
26.6%
Immigrants | Central America
0.0
/100
|
#293
Tragic
26.6%

Demographics Similar to Carpatho Rusyns by Disability Age 65 to 74

In terms of disability age 65 to 74, the demographic groups most similar to Carpatho Rusyns are Egyptian (21.6%, a difference of 0.030%), Immigrants from North Macedonia (21.6%, a difference of 0.050%), Zimbabwean (21.5%, a difference of 0.080%), Immigrants from Europe (21.6%, a difference of 0.10%), and Immigrants from Pakistan (21.5%, a difference of 0.11%).
DemographicsRating | RankDisability Age 65 to 74
Immigrants | Romania
99.5
/100
|
#55
Exceptional
21.5%
Immigrants | Denmark
99.5
/100
|
#56
Exceptional
21.5%
Immigrants | Asia
99.5
/100
|
#57
Exceptional
21.5%
Immigrants | Pakistan
99.5
/100
|
#58
Exceptional
21.5%
Zimbabweans
99.5
/100
|
#59
Exceptional
21.5%
Immigrants | North Macedonia
99.5
/100
|
#60
Exceptional
21.6%
Egyptians
99.5
/100
|
#61
Exceptional
21.6%
Carpatho Rusyns
99.5
/100
|
#62
Exceptional
21.6%
Immigrants | Europe
99.4
/100
|
#63
Exceptional
21.6%
Immigrants | Latvia
99.4
/100
|
#64
Exceptional
21.6%
Immigrants | Russia
99.4
/100
|
#65
Exceptional
21.6%
Maltese
99.4
/100
|
#66
Exceptional
21.6%
Immigrants | South Africa
99.3
/100
|
#67
Exceptional
21.7%
Immigrants | Scotland
99.3
/100
|
#68
Exceptional
21.7%
Immigrants | Egypt
99.2
/100
|
#69
Exceptional
21.7%