Immigrants from Dominican Republic vs Carpatho Rusyn Poverty
COMPARE
Immigrants from Dominican Republic
Carpatho Rusyn
Poverty
Poverty Comparison
Immigrants from Dominican Republic
Carpatho Rusyns
17.8%
POVERTY
0.0/ 100
METRIC RATING
331st/ 347
METRIC RANK
11.3%
POVERTY
97.2/ 100
METRIC RATING
74th/ 347
METRIC RANK
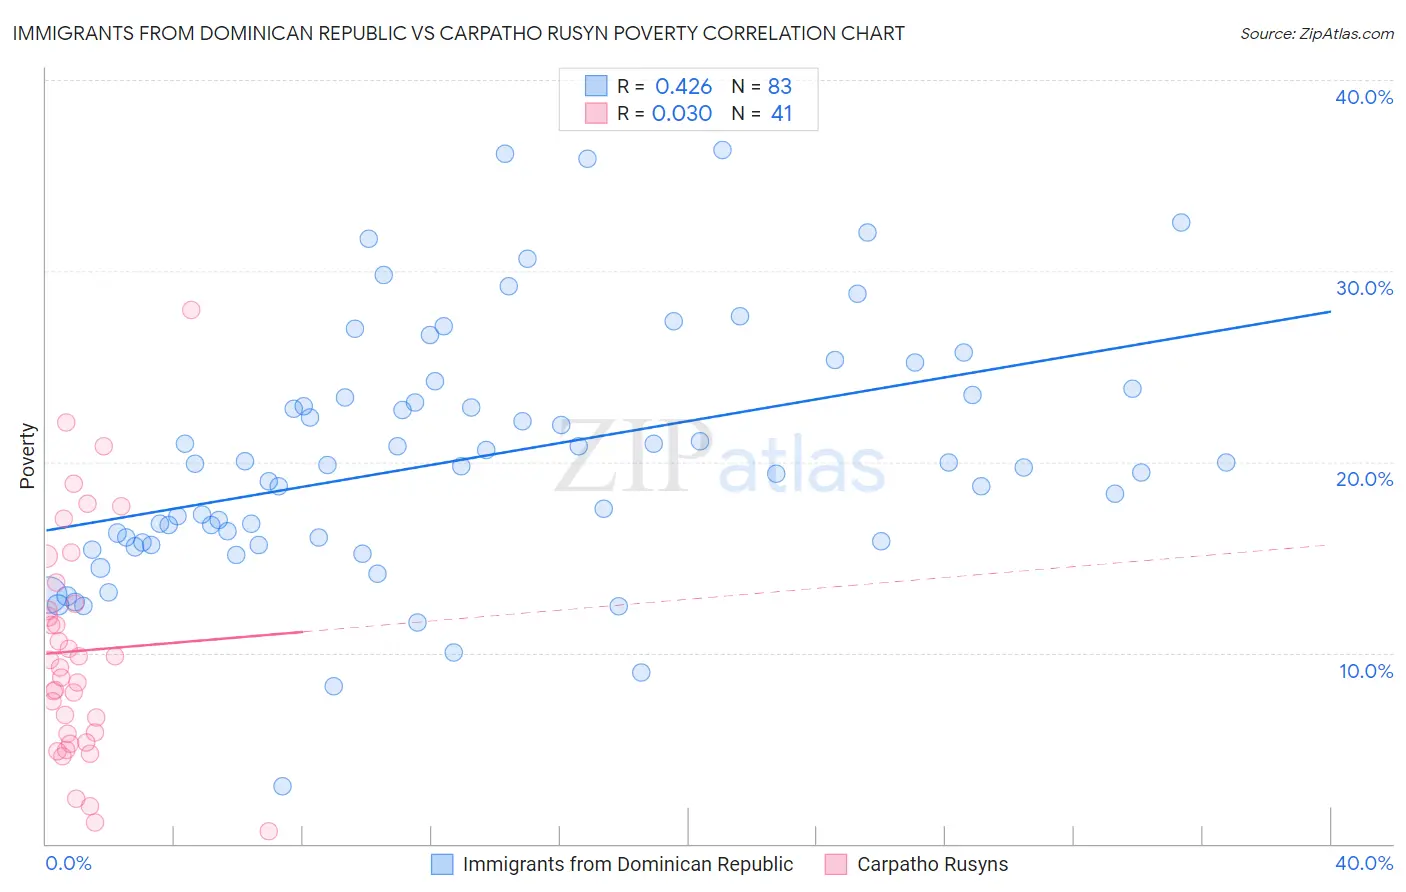
Immigrants from Dominican Republic vs Carpatho Rusyn Poverty Correlation Chart
The statistical analysis conducted on geographies consisting of 274,963,849 people shows a moderate positive correlation between the proportion of Immigrants from Dominican Republic and poverty level in the United States with a correlation coefficient (R) of 0.426 and weighted average of 17.8%. Similarly, the statistical analysis conducted on geographies consisting of 58,869,628 people shows no correlation between the proportion of Carpatho Rusyns and poverty level in the United States with a correlation coefficient (R) of 0.030 and weighted average of 11.3%, a difference of 58.1%.
Poverty Correlation Summary
| Measurement | Immigrants from Dominican Republic | Carpatho Rusyn |
| Minimum | 3.0% | 0.68% |
| Maximum | 36.4% | 27.9% |
| Range | 33.4% | 27.2% |
| Mean | 20.2% | 10.1% |
| Median | 19.8% | 9.2% |
| Interquartile 25% (IQ1) | 15.8% | 5.6% |
| Interquartile 75% (IQ3) | 23.5% | 13.1% |
| Interquartile Range (IQR) | 7.7% | 7.6% |
| Standard Deviation (Sample) | 6.5% | 6.0% |
| Standard Deviation (Population) | 6.5% | 5.9% |
Similar Demographics by Poverty
Demographics Similar to Immigrants from Dominican Republic by Poverty
In terms of poverty, the demographic groups most similar to Immigrants from Dominican Republic are Dominican (17.6%, a difference of 0.92%), Native/Alaskan (18.1%, a difference of 1.4%), Black/African American (17.3%, a difference of 3.2%), Houma (18.4%, a difference of 3.5%), and Apache (18.4%, a difference of 3.5%).
| Demographics | Rating | Rank | Poverty |
| Yakama | 0.0 /100 | #324 | Tragic 16.7% |
| Central American Indians | 0.0 /100 | #325 | Tragic 16.7% |
| Paiute | 0.0 /100 | #326 | Tragic 16.7% |
| Kiowa | 0.0 /100 | #327 | Tragic 16.8% |
| Ute | 0.0 /100 | #328 | Tragic 16.9% |
| Blacks/African Americans | 0.0 /100 | #329 | Tragic 17.3% |
| Dominicans | 0.0 /100 | #330 | Tragic 17.6% |
| Immigrants | Dominican Republic | 0.0 /100 | #331 | Tragic 17.8% |
| Natives/Alaskans | 0.0 /100 | #332 | Tragic 18.1% |
| Houma | 0.0 /100 | #333 | Tragic 18.4% |
| Apache | 0.0 /100 | #334 | Tragic 18.4% |
| Cheyenne | 0.0 /100 | #335 | Tragic 18.9% |
| Pueblo | 0.0 /100 | #336 | Tragic 19.4% |
| Sioux | 0.0 /100 | #337 | Tragic 19.8% |
| Yuman | 0.0 /100 | #338 | Tragic 20.2% |
Demographics Similar to Carpatho Rusyns by Poverty
In terms of poverty, the demographic groups most similar to Carpatho Rusyns are European (11.3%, a difference of 0.050%), Immigrants from Belgium (11.3%, a difference of 0.050%), Zimbabwean (11.3%, a difference of 0.070%), Immigrants from Canada (11.3%, a difference of 0.090%), and Serbian (11.2%, a difference of 0.18%).
| Demographics | Rating | Rank | Poverty |
| Immigrants | Australia | 97.4 /100 | #67 | Exceptional 11.2% |
| Slovaks | 97.4 /100 | #68 | Exceptional 11.2% |
| Serbians | 97.4 /100 | #69 | Exceptional 11.2% |
| Immigrants | Canada | 97.3 /100 | #70 | Exceptional 11.3% |
| Zimbabweans | 97.3 /100 | #71 | Exceptional 11.3% |
| Europeans | 97.2 /100 | #72 | Exceptional 11.3% |
| Immigrants | Belgium | 97.2 /100 | #73 | Exceptional 11.3% |
| Carpatho Rusyns | 97.2 /100 | #74 | Exceptional 11.3% |
| Immigrants | Eastern Europe | 97.0 /100 | #75 | Exceptional 11.3% |
| Immigrants | North America | 96.8 /100 | #76 | Exceptional 11.3% |
| Immigrants | Eastern Asia | 96.7 /100 | #77 | Exceptional 11.3% |
| Dutch | 96.7 /100 | #78 | Exceptional 11.3% |
| Cambodians | 96.7 /100 | #79 | Exceptional 11.3% |
| Indians (Asian) | 96.6 /100 | #80 | Exceptional 11.3% |
| Irish | 96.6 /100 | #81 | Exceptional 11.3% |