Immigrants from Nicaragua vs Arab Child Poverty Under the Age of 5
COMPARE
Immigrants from Nicaragua
Arab
Child Poverty Under the Age of 5
Child Poverty Under the Age of 5 Comparison
Immigrants from Nicaragua
Arabs
19.8%
CHILD POVERTY UNDER THE AGE OF 5
0.3/ 100
METRIC RATING
252nd/ 347
METRIC RANK
17.4%
CHILD POVERTY UNDER THE AGE OF 5
40.7/ 100
METRIC RATING
182nd/ 347
METRIC RANK
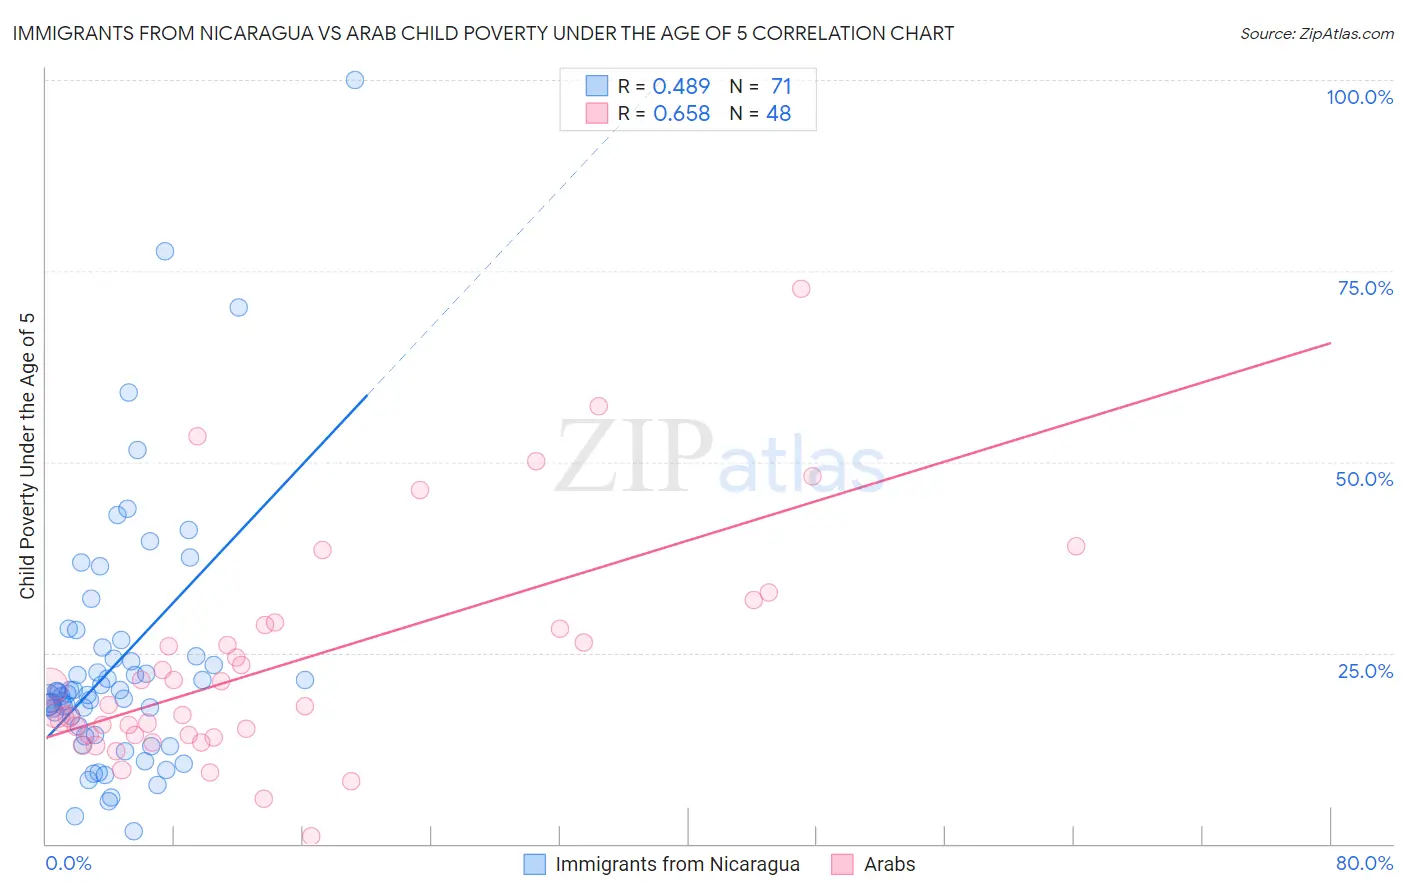
Immigrants from Nicaragua vs Arab Child Poverty Under the Age of 5 Correlation Chart
The statistical analysis conducted on geographies consisting of 232,258,486 people shows a moderate positive correlation between the proportion of Immigrants from Nicaragua and poverty level among children under the age of 5 in the United States with a correlation coefficient (R) of 0.489 and weighted average of 19.8%. Similarly, the statistical analysis conducted on geographies consisting of 461,564,748 people shows a significant positive correlation between the proportion of Arabs and poverty level among children under the age of 5 in the United States with a correlation coefficient (R) of 0.658 and weighted average of 17.4%, a difference of 13.7%.
Child Poverty Under the Age of 5 Correlation Summary
| Measurement | Immigrants from Nicaragua | Arab |
| Minimum | 1.7% | 0.94% |
| Maximum | 100.0% | 72.7% |
| Range | 98.3% | 71.8% |
| Mean | 23.5% | 23.4% |
| Median | 19.7% | 18.1% |
| Interquartile 25% (IQ1) | 14.3% | 14.3% |
| Interquartile 75% (IQ3) | 24.5% | 28.4% |
| Interquartile Range (IQR) | 10.2% | 14.2% |
| Standard Deviation (Sample) | 16.7% | 14.5% |
| Standard Deviation (Population) | 16.5% | 14.4% |
Similar Demographics by Child Poverty Under the Age of 5
Demographics Similar to Immigrants from Nicaragua by Child Poverty Under the Age of 5
In terms of child poverty under the age of 5, the demographic groups most similar to Immigrants from Nicaragua are Pennsylvania German (19.8%, a difference of 0.040%), Nonimmigrants (19.7%, a difference of 0.22%), Immigrants from Middle Africa (19.7%, a difference of 0.27%), Marshallese (19.7%, a difference of 0.29%), and Guyanese (19.7%, a difference of 0.30%).
| Demographics | Rating | Rank | Child Poverty Under the Age of 5 |
| Immigrants | Western Africa | 0.4 /100 | #245 | Tragic 19.7% |
| Cree | 0.4 /100 | #246 | Tragic 19.7% |
| Guyanese | 0.4 /100 | #247 | Tragic 19.7% |
| Marshallese | 0.4 /100 | #248 | Tragic 19.7% |
| Immigrants | Middle Africa | 0.4 /100 | #249 | Tragic 19.7% |
| Immigrants | Nonimmigrants | 0.4 /100 | #250 | Tragic 19.7% |
| Pennsylvania Germans | 0.3 /100 | #251 | Tragic 19.8% |
| Immigrants | Nicaragua | 0.3 /100 | #252 | Tragic 19.8% |
| Mexican American Indians | 0.3 /100 | #253 | Tragic 19.9% |
| Fijians | 0.3 /100 | #254 | Tragic 19.9% |
| Immigrants | Cuba | 0.2 /100 | #255 | Tragic 19.9% |
| Immigrants | Barbados | 0.2 /100 | #256 | Tragic 20.0% |
| Shoshone | 0.2 /100 | #257 | Tragic 20.0% |
| Immigrants | St. Vincent and the Grenadines | 0.2 /100 | #258 | Tragic 20.0% |
| Immigrants | El Salvador | 0.2 /100 | #259 | Tragic 20.0% |
Demographics Similar to Arabs by Child Poverty Under the Age of 5
In terms of child poverty under the age of 5, the demographic groups most similar to Arabs are Immigrants from Germany (17.4%, a difference of 0.030%), Lebanese (17.4%, a difference of 0.040%), Hawaiian (17.4%, a difference of 0.080%), South American Indian (17.4%, a difference of 0.080%), and Immigrants from Costa Rica (17.4%, a difference of 0.18%).
| Demographics | Rating | Rank | Child Poverty Under the Age of 5 |
| Immigrants | Lebanon | 47.6 /100 | #175 | Average 17.3% |
| Immigrants | Iraq | 45.2 /100 | #176 | Average 17.3% |
| Immigrants | Sierra Leone | 43.6 /100 | #177 | Average 17.3% |
| Immigrants | Cameroon | 42.7 /100 | #178 | Average 17.4% |
| Hawaiians | 41.5 /100 | #179 | Average 17.4% |
| South American Indians | 41.4 /100 | #180 | Average 17.4% |
| Immigrants | Germany | 41.0 /100 | #181 | Average 17.4% |
| Arabs | 40.7 /100 | #182 | Average 17.4% |
| Lebanese | 40.3 /100 | #183 | Average 17.4% |
| Immigrants | Costa Rica | 39.0 /100 | #184 | Fair 17.4% |
| Immigrants | Armenia | 38.0 /100 | #185 | Fair 17.5% |
| Immigrants | Bosnia and Herzegovina | 35.0 /100 | #186 | Fair 17.5% |
| Kenyans | 34.7 /100 | #187 | Fair 17.5% |
| Carpatho Rusyns | 33.6 /100 | #188 | Fair 17.5% |
| French | 33.6 /100 | #189 | Fair 17.5% |