Immigrants from Canada vs Arab Child Poverty Under the Age of 5
COMPARE
Immigrants from Canada
Arab
Child Poverty Under the Age of 5
Child Poverty Under the Age of 5 Comparison
Immigrants from Canada
Arabs
15.8%
CHILD POVERTY UNDER THE AGE OF 5
95.9/ 100
METRIC RATING
100th/ 347
METRIC RANK
17.4%
CHILD POVERTY UNDER THE AGE OF 5
40.7/ 100
METRIC RATING
182nd/ 347
METRIC RANK
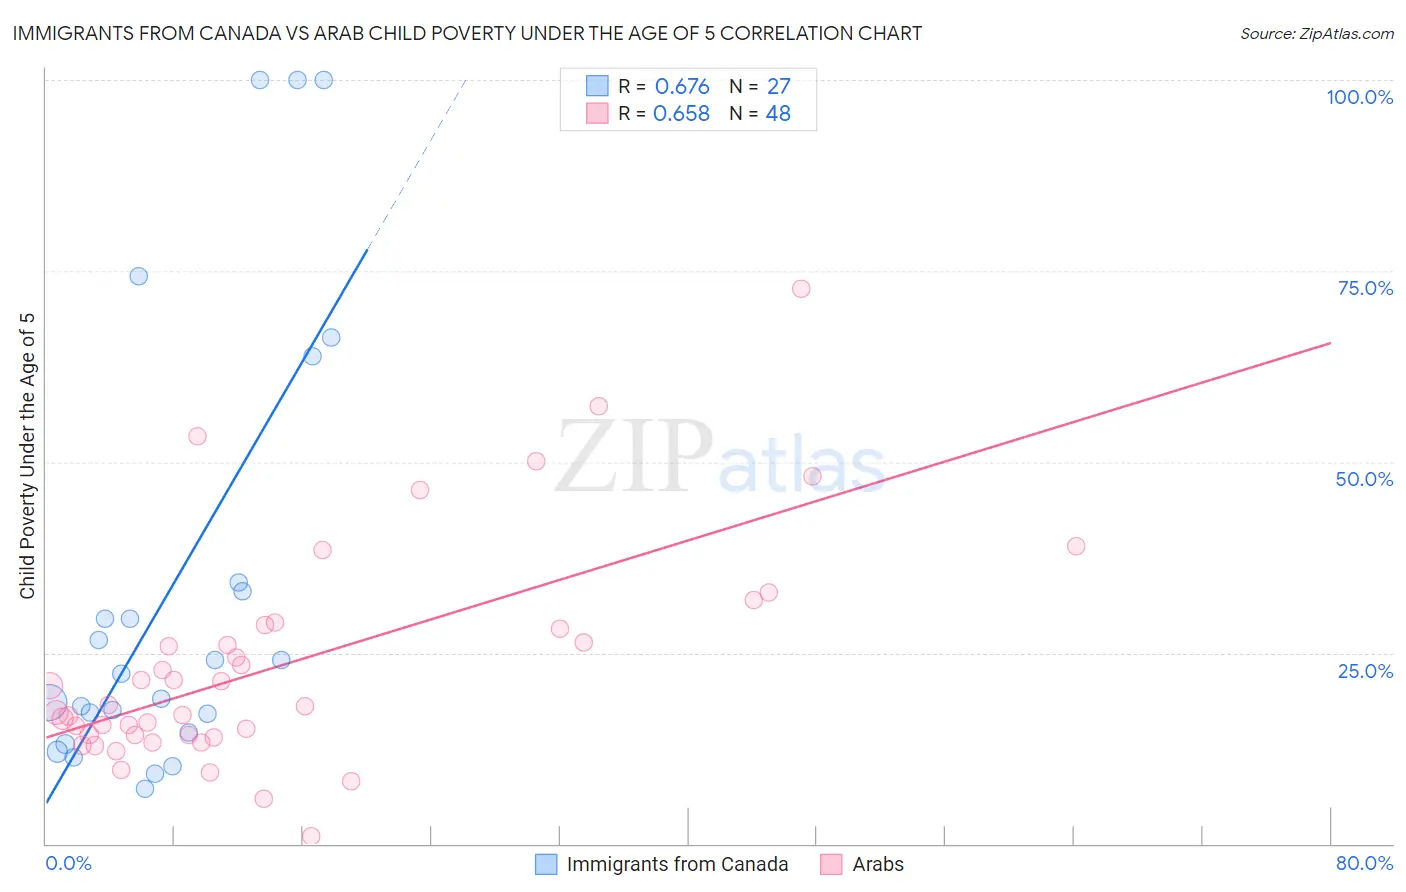
Immigrants from Canada vs Arab Child Poverty Under the Age of 5 Correlation Chart
The statistical analysis conducted on geographies consisting of 434,512,181 people shows a significant positive correlation between the proportion of Immigrants from Canada and poverty level among children under the age of 5 in the United States with a correlation coefficient (R) of 0.676 and weighted average of 15.8%. Similarly, the statistical analysis conducted on geographies consisting of 461,564,748 people shows a significant positive correlation between the proportion of Arabs and poverty level among children under the age of 5 in the United States with a correlation coefficient (R) of 0.658 and weighted average of 17.4%, a difference of 10.0%.
Child Poverty Under the Age of 5 Correlation Summary
| Measurement | Immigrants from Canada | Arab |
| Minimum | 7.2% | 0.94% |
| Maximum | 100.0% | 72.7% |
| Range | 92.8% | 71.8% |
| Mean | 33.8% | 23.4% |
| Median | 22.3% | 18.1% |
| Interquartile 25% (IQ1) | 14.6% | 14.3% |
| Interquartile 75% (IQ3) | 34.1% | 28.4% |
| Interquartile Range (IQR) | 19.5% | 14.2% |
| Standard Deviation (Sample) | 29.3% | 14.5% |
| Standard Deviation (Population) | 28.8% | 14.4% |
Similar Demographics by Child Poverty Under the Age of 5
Demographics Similar to Immigrants from Canada by Child Poverty Under the Age of 5
In terms of child poverty under the age of 5, the demographic groups most similar to Immigrants from Canada are Palestinian (15.8%, a difference of 0.010%), Immigrants from Zimbabwe (15.8%, a difference of 0.010%), Immigrants from South Africa (15.8%, a difference of 0.13%), Armenian (15.8%, a difference of 0.14%), and Macedonian (15.8%, a difference of 0.20%).
| Demographics | Rating | Rank | Child Poverty Under the Age of 5 |
| Ukrainians | 97.1 /100 | #93 | Exceptional 15.7% |
| Immigrants | South Eastern Asia | 97.1 /100 | #94 | Exceptional 15.7% |
| Immigrants | Switzerland | 96.4 /100 | #95 | Exceptional 15.8% |
| Immigrants | Kazakhstan | 96.2 /100 | #96 | Exceptional 15.8% |
| Macedonians | 96.2 /100 | #97 | Exceptional 15.8% |
| Immigrants | South Africa | 96.1 /100 | #98 | Exceptional 15.8% |
| Palestinians | 95.9 /100 | #99 | Exceptional 15.8% |
| Immigrants | Canada | 95.9 /100 | #100 | Exceptional 15.8% |
| Immigrants | Zimbabwe | 95.9 /100 | #101 | Exceptional 15.8% |
| Armenians | 95.7 /100 | #102 | Exceptional 15.8% |
| Europeans | 95.3 /100 | #103 | Exceptional 15.9% |
| Immigrants | North America | 94.9 /100 | #104 | Exceptional 15.9% |
| Immigrants | Spain | 94.8 /100 | #105 | Exceptional 15.9% |
| Tlingit-Haida | 94.7 /100 | #106 | Exceptional 15.9% |
| Slovenes | 94.4 /100 | #107 | Exceptional 16.0% |
Demographics Similar to Arabs by Child Poverty Under the Age of 5
In terms of child poverty under the age of 5, the demographic groups most similar to Arabs are Immigrants from Germany (17.4%, a difference of 0.030%), Lebanese (17.4%, a difference of 0.040%), Hawaiian (17.4%, a difference of 0.080%), South American Indian (17.4%, a difference of 0.080%), and Immigrants from Costa Rica (17.4%, a difference of 0.18%).
| Demographics | Rating | Rank | Child Poverty Under the Age of 5 |
| Immigrants | Lebanon | 47.6 /100 | #175 | Average 17.3% |
| Immigrants | Iraq | 45.2 /100 | #176 | Average 17.3% |
| Immigrants | Sierra Leone | 43.6 /100 | #177 | Average 17.3% |
| Immigrants | Cameroon | 42.7 /100 | #178 | Average 17.4% |
| Hawaiians | 41.5 /100 | #179 | Average 17.4% |
| South American Indians | 41.4 /100 | #180 | Average 17.4% |
| Immigrants | Germany | 41.0 /100 | #181 | Average 17.4% |
| Arabs | 40.7 /100 | #182 | Average 17.4% |
| Lebanese | 40.3 /100 | #183 | Average 17.4% |
| Immigrants | Costa Rica | 39.0 /100 | #184 | Fair 17.4% |
| Immigrants | Armenia | 38.0 /100 | #185 | Fair 17.5% |
| Immigrants | Bosnia and Herzegovina | 35.0 /100 | #186 | Fair 17.5% |
| Kenyans | 34.7 /100 | #187 | Fair 17.5% |
| Carpatho Rusyns | 33.6 /100 | #188 | Fair 17.5% |
| French | 33.6 /100 | #189 | Fair 17.5% |