Immigrants from Somalia vs Arab Child Poverty Under the Age of 5

COMPARE

Immigrants from Somalia
Race
Ancestry
AfghanAfricanAlaska NativeAlaskan AthabascanAlbanianAleutAlsatianAmericanApacheArapahoArgentineanArmenianAssyrian/Chaldean/SyriacAustralianAustrianBahamianBangladeshiBarbadianBasqueBelgianBelizeanBermudanBhutaneseBlackfeetBolivianBrazilianBritishBritish West IndianBulgarianBurmeseCajunCambodianCanadianCape VerdeanCarpatho RusynCelticCentral AmericanCentral American IndianCherokeeCheyenneChickasawChileanChineseChippewaChoctawColombianColvilleComancheCosta RicanCreeCreekCroatianCrowCubanCypriotCzechCzechoslovakianDanishDelawareDominicanDutchDutch West IndianEastern EuropeanEcuadorianEgyptianEnglishEstonianEthiopianEuropeanFijianFilipinoFinnishFrenchFrench American IndianFrench CanadianGermanGerman RussianGhanaianGreekGuamanian/ChamorroGuatemalanGuyaneseHaitianHmongHonduranHopiHoumaHungarianIcelanderIndian (Asian)IndonesianInupiatIranianIraqiIrishIroquoisIsraeliItalianJamaicanJapaneseJordanianKenyanKiowaKoreanLaotianLatvianLebaneseLiberianLithuanianLumbeeLuxembourgerMacedonianMalaysianMalteseMarshalleseMenomineeMexicanMexican American IndianMongolianMoroccanNative HawaiianNavajoNepaleseNew ZealanderNicaraguanNigerianNorthern EuropeanNorwegianOkinawanOsageOttawaPaiutePakistaniPalestinianPanamanianParaguayanPennsylvania GermanPeruvianPimaPolishPortuguesePotawatomiPuebloPuerto RicanPuget Sound SalishRomanianRussianSalvadoranSamoanScandinavianScotch-IrishScottishSeminoleSenegaleseSerbianShoshoneSierra LeoneanSiouxSlavicSlovakSloveneSomaliSouth AfricanSouth AmericanSouth American IndianSoviet UnionSpaniardSpanishSpanish AmericanSpanish American IndianSri LankanSubsaharan AfricanSudaneseSwedishSwissSyrianTaiwaneseThaiTlingit-HaidaTohono O'OdhamTonganTrinidadian and TobagonianTsimshianTurkishU.S. Virgin IslanderUgandanUkrainianUruguayanUteVenezuelanVietnameseWelshWest IndianYakamaYaquiYugoslavianYumanYup'ikZimbabwean
Immigration
NonimmigrantsImmigrantsAfghanistanAfricaAlbaniaArgentinaArmeniaAsiaAustraliaAustriaBahamasBangladeshBarbadosBelarusBelgiumBelizeBoliviaBosnia and HerzegovinaBrazilBulgariaBurma/MyanmarCabo VerdeCambodiaCameroonCanadaCaribbeanCentral AmericaChileChinaColombiaCongoCosta RicaCroatiaCubaCzechoslovakiaDenmarkDominicaDominican RepublicEastern AfricaEastern AsiaEastern EuropeEcuadorEgyptEl SalvadorEnglandEritreaEthiopiaEuropeFijiFranceGermanyGhanaGreeceGrenadaGuatemalaGuyanaHaitiHondurasHong KongHungaryIndiaIndonesiaIranIraqIrelandIsraelItalyJamaicaJapanJordanKazakhstanKenyaKoreaKuwaitLaosLatin AmericaLatviaLebanonLiberiaLithuaniaMalaysiaMexicoMicronesiaMiddle AfricaMoldovaMoroccoNepalNetherlandsNicaraguaNigeriaNorth AmericaNorth MacedoniaNorthern AfricaNorthern EuropeNorwayOceaniaPakistanPanamaPeruPhilippinesPolandPortugalRomaniaRussiaSaudi ArabiaScotlandSenegalSerbiaSierra LeoneSingaporeSomaliaSouth AfricaSouth AmericaSouth Central AsiaSouth Eastern AsiaSouthern EuropeSpainSri LankaSt. Vincent and the GrenadinesSudanSwedenSwitzerlandSyriaTaiwanThailandTrinidad and TobagoTurkeyUgandaUkraineUruguayUzbekistanVenezuelaVietnamWest IndiesWestern AfricaWestern AsiaWestern EuropeYemenZaireZimbabweAzores
Arab
Race
Ancestry
AfghanAfricanAlaska NativeAlaskan AthabascanAlbanianAleutAlsatianAmericanApacheArabArapahoArgentineanArmenianAssyrian/Chaldean/SyriacAustralianAustrianBahamianBangladeshiBarbadianBasqueBelgianBelizeanBermudanBhutaneseBlackfeetBolivianBrazilianBritishBritish West IndianBulgarianBurmeseCajunCambodianCanadianCape VerdeanCarpatho RusynCelticCentral AmericanCentral American IndianCherokeeCheyenneChickasawChileanChineseChippewaChoctawColombianColvilleComancheCosta RicanCreeCreekCroatianCrowCubanCypriotCzechCzechoslovakianDanishDelawareDominicanDutchDutch West IndianEastern EuropeanEcuadorianEgyptianEnglishEstonianEthiopianEuropeanFijianFilipinoFinnishFrenchFrench American IndianFrench CanadianGermanGerman RussianGhanaianGreekGuamanian/ChamorroGuatemalanGuyaneseHaitianHmongHonduranHopiHoumaHungarianIcelanderIndian (Asian)IndonesianInupiatIranianIraqiIrishIroquoisIsraeliItalianJamaicanJapaneseJordanianKenyanKiowaKoreanLaotianLatvianLebaneseLiberianLithuanianLumbeeLuxembourgerMacedonianMalaysianMalteseMarshalleseMenomineeMexicanMexican American IndianMongolianMoroccanNative HawaiianNavajoNepaleseNew ZealanderNicaraguanNigerianNorthern EuropeanNorwegianOkinawanOsageOttawaPaiutePakistaniPalestinianPanamanianParaguayanPennsylvania GermanPeruvianPimaPolishPortuguesePotawatomiPuebloPuerto RicanPuget Sound SalishRomanianRussianSalvadoranSamoanScandinavianScotch-IrishScottishSeminoleSenegaleseSerbianShoshoneSierra LeoneanSiouxSlavicSlovakSloveneSomaliSouth AfricanSouth AmericanSouth American IndianSoviet UnionSpaniardSpanishSpanish AmericanSpanish American IndianSri LankanSubsaharan AfricanSudaneseSwedishSwissSyrianTaiwaneseThaiTlingit-HaidaTohono O'OdhamTonganTrinidadian and TobagonianTsimshianTurkishU.S. Virgin IslanderUgandanUkrainianUruguayanUteVenezuelanVietnameseWelshWest IndianYakamaYaquiYugoslavianYumanYup'ikZimbabwean
Immigration
NonimmigrantsImmigrantsAfghanistanAfricaAlbaniaArgentinaArmeniaAsiaAustraliaAustriaBahamasBangladeshBarbadosBelarusBelgiumBelizeBoliviaBosnia and HerzegovinaBrazilBulgariaBurma/MyanmarCabo VerdeCambodiaCameroonCanadaCaribbeanCentral AmericaChileChinaColombiaCongoCosta RicaCroatiaCubaCzechoslovakiaDenmarkDominicaDominican RepublicEastern AfricaEastern AsiaEastern EuropeEcuadorEgyptEl SalvadorEnglandEritreaEthiopiaEuropeFijiFranceGermanyGhanaGreeceGrenadaGuatemalaGuyanaHaitiHondurasHong KongHungaryIndiaIndonesiaIranIraqIrelandIsraelItalyJamaicaJapanJordanKazakhstanKenyaKoreaKuwaitLaosLatin AmericaLatviaLebanonLiberiaLithuaniaMalaysiaMexicoMicronesiaMiddle AfricaMoldovaMoroccoNepalNetherlandsNicaraguaNigeriaNorth AmericaNorth MacedoniaNorthern AfricaNorthern EuropeNorwayOceaniaPakistanPanamaPeruPhilippinesPolandPortugalRomaniaRussiaSaudi ArabiaScotlandSenegalSerbiaSierra LeoneSingaporeSouth AfricaSouth AmericaSouth Central AsiaSouth Eastern AsiaSouthern EuropeSpainSri LankaSt. Vincent and the GrenadinesSudanSwedenSwitzerlandSyriaTaiwanThailandTrinidad and TobagoTurkeyUgandaUkraineUruguayUzbekistanVenezuelaVietnamWest IndiesWestern AfricaWestern AsiaWestern EuropeYemenZaireZimbabweAzores
Child Poverty Under the Age of 5
Income
Poverty
Unemployment
Labor Participation
Family Structure
Vehicle Availability
Education Level
Disability

Child Poverty Under the Age of 5 Comparison

Immigrants from Somalia

Arabs

Tragic
Average
21.6%
CHILD POVERTY UNDER THE AGE OF 5
0.0/ 100
METRIC RATING
292nd/ 347
METRIC RANK
17.4%
CHILD POVERTY UNDER THE AGE OF 5
40.7/ 100
METRIC RATING
182nd/ 347
METRIC RANK

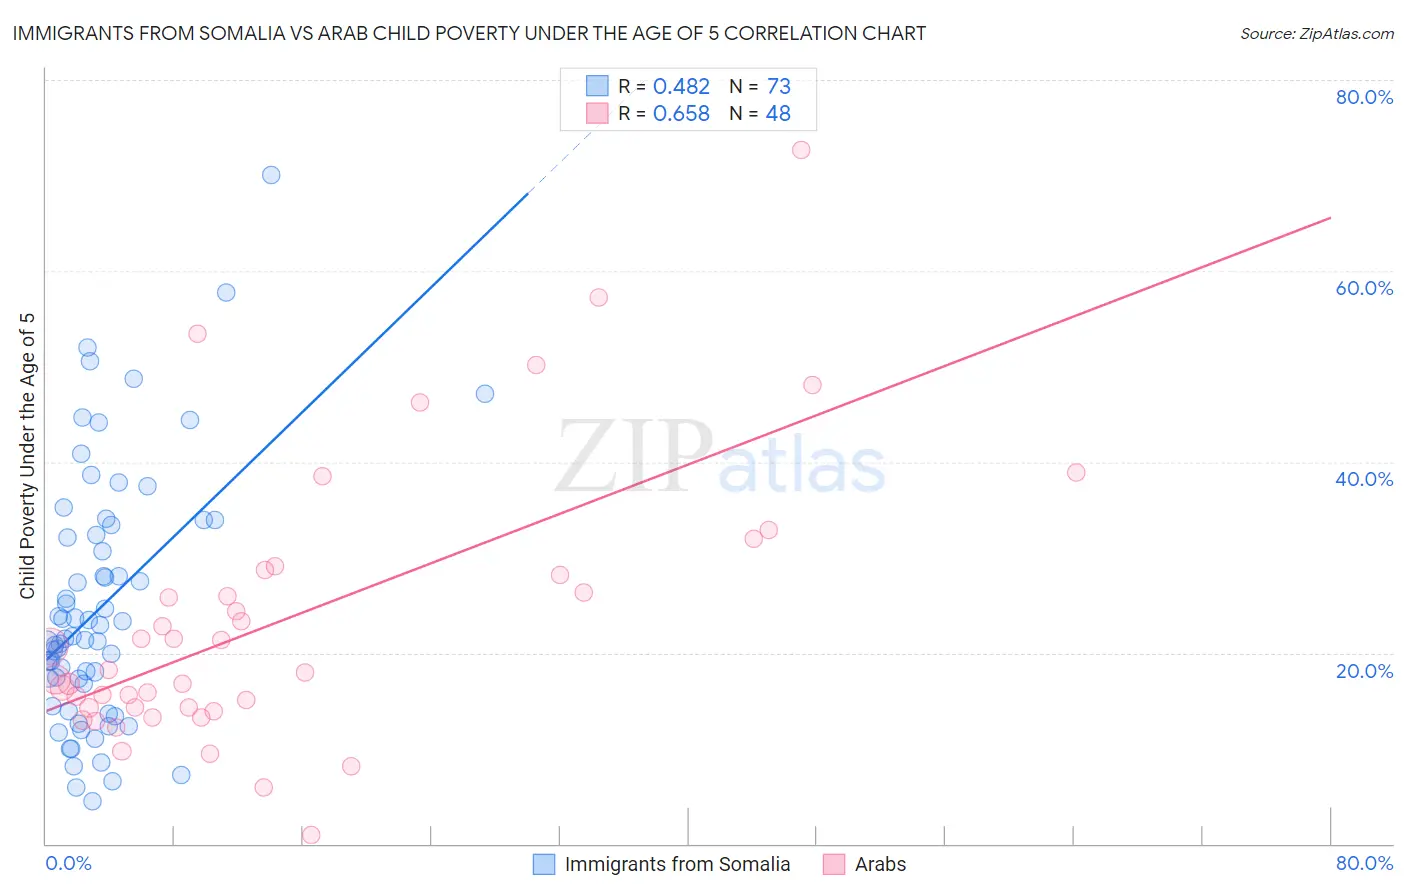
Immigrants from Somalia vs Arab Child Poverty Under the Age of 5 Correlation Chart

The statistical analysis conducted on geographies consisting of 91,565,484 people shows a moderate positive correlation between the proportion of Immigrants from Somalia and poverty level among children under the age of 5 in the United States with a correlation coefficient (R) of 0.482 and weighted average of 21.6%. Similarly, the statistical analysis conducted on geographies consisting of 461,564,748 people shows a significant positive correlation between the proportion of Arabs and poverty level among children under the age of 5 in the United States with a correlation coefficient (R) of 0.658 and weighted average of 17.4%, a difference of 23.9%.
Immigrants from Somalia vs Arab Child Poverty Under the Age of 5

Child Poverty Under the Age of 5 Correlation Summary

MeasurementImmigrants from SomaliaArab
Minimum4.5%0.94%
Maximum70.0%72.7%
Range65.5%71.8%
Mean24.8%23.4%
Median21.5%18.1%
Interquartile 25% (IQ1)15.6%14.3%
Interquartile 75% (IQ3)32.8%28.4%
Interquartile Range (IQR)17.2%14.2%
Standard Deviation (Sample)13.3%14.5%
Standard Deviation (Population)13.2%14.4%

Similar Demographics by Child Poverty Under the Age of 5

Demographics Similar to Immigrants from Somalia by Child Poverty Under the Age of 5

In terms of child poverty under the age of 5, the demographic groups most similar to Immigrants from Somalia are Mexican (21.6%, a difference of 0.28%), Guatemalan (21.6%, a difference of 0.42%), British West Indian (21.4%, a difference of 0.60%), Cherokee (21.7%, a difference of 0.68%), and Immigrants from Caribbean (21.4%, a difference of 0.77%).
DemographicsRating | RankChild Poverty Under the Age of 5
Haitians
0.0
/100
|
#285
Tragic
21.2%
Immigrants | Latin America
0.0
/100
|
#286
Tragic
21.2%
Immigrants | Zaire
0.0
/100
|
#287
Tragic
21.3%
Immigrants | Senegal
0.0
/100
|
#288
Tragic
21.3%
Immigrants | Haiti
0.0
/100
|
#289
Tragic
21.3%
Immigrants | Caribbean
0.0
/100
|
#290
Tragic
21.4%
British West Indians
0.0
/100
|
#291
Tragic
21.4%
Immigrants | Somalia
0.0
/100
|
#292
Tragic
21.6%
Mexicans
0.0
/100
|
#293
Tragic
21.6%
Guatemalans
0.0
/100
|
#294
Tragic
21.6%
Cherokee
0.0
/100
|
#295
Tragic
21.7%
Yaqui
0.0
/100
|
#296
Tragic
21.7%
Hispanics or Latinos
0.0
/100
|
#297
Tragic
21.7%
Blackfeet
0.0
/100
|
#298
Tragic
21.8%
Chickasaw
0.0
/100
|
#299
Tragic
21.8%

Demographics Similar to Arabs by Child Poverty Under the Age of 5

In terms of child poverty under the age of 5, the demographic groups most similar to Arabs are Immigrants from Germany (17.4%, a difference of 0.030%), Lebanese (17.4%, a difference of 0.040%), Hawaiian (17.4%, a difference of 0.080%), South American Indian (17.4%, a difference of 0.080%), and Immigrants from Costa Rica (17.4%, a difference of 0.18%).
DemographicsRating | RankChild Poverty Under the Age of 5
Immigrants | Lebanon
47.6
/100
|
#175
Average
17.3%
Immigrants | Iraq
45.2
/100
|
#176
Average
17.3%
Immigrants | Sierra Leone
43.6
/100
|
#177
Average
17.3%
Immigrants | Cameroon
42.7
/100
|
#178
Average
17.4%
Hawaiians
41.5
/100
|
#179
Average
17.4%
South American Indians
41.4
/100
|
#180
Average
17.4%
Immigrants | Germany
41.0
/100
|
#181
Average
17.4%
Arabs
40.7
/100
|
#182
Average
17.4%
Lebanese
40.3
/100
|
#183
Average
17.4%
Immigrants | Costa Rica
39.0
/100
|
#184
Fair
17.4%
Immigrants | Armenia
38.0
/100
|
#185
Fair
17.5%
Immigrants | Bosnia and Herzegovina
35.0
/100
|
#186
Fair
17.5%
Kenyans
34.7
/100
|
#187
Fair
17.5%
Carpatho Rusyns
33.6
/100
|
#188
Fair
17.5%
French
33.6
/100
|
#189
Fair
17.5%