Thai vs Arab Child Poverty Under the Age of 5
COMPARE
Thai
Arab
Child Poverty Under the Age of 5
Child Poverty Under the Age of 5 Comparison
Thais
Arabs
12.3%
CHILD POVERTY UNDER THE AGE OF 5
100.0/ 100
METRIC RATING
4th/ 347
METRIC RANK
17.4%
CHILD POVERTY UNDER THE AGE OF 5
40.7/ 100
METRIC RATING
182nd/ 347
METRIC RANK
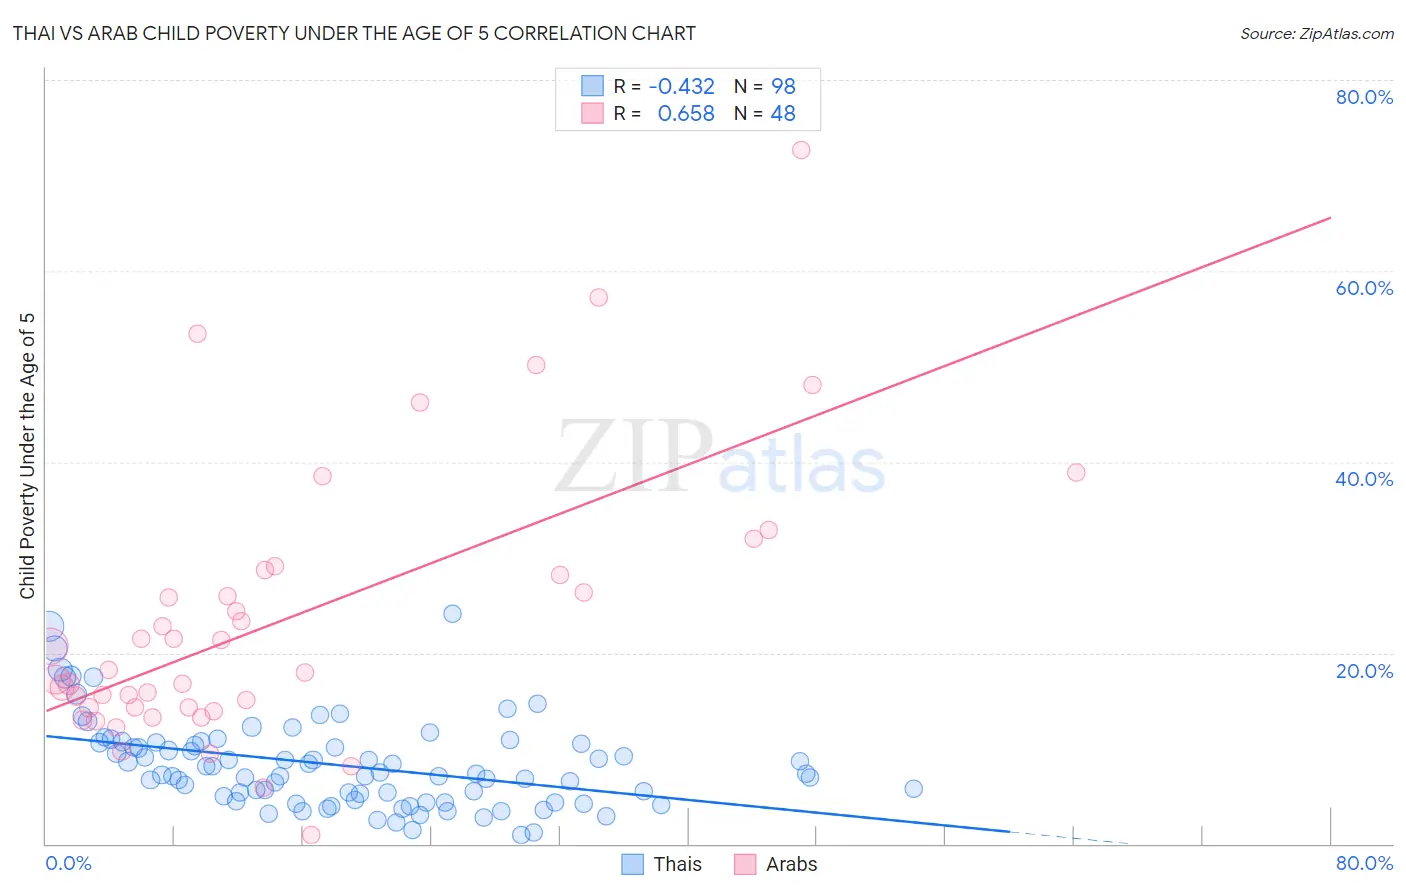
Thai vs Arab Child Poverty Under the Age of 5 Correlation Chart
The statistical analysis conducted on geographies consisting of 451,866,941 people shows a moderate negative correlation between the proportion of Thais and poverty level among children under the age of 5 in the United States with a correlation coefficient (R) of -0.432 and weighted average of 12.3%. Similarly, the statistical analysis conducted on geographies consisting of 461,564,748 people shows a significant positive correlation between the proportion of Arabs and poverty level among children under the age of 5 in the United States with a correlation coefficient (R) of 0.658 and weighted average of 17.4%, a difference of 41.4%.
Child Poverty Under the Age of 5 Correlation Summary
| Measurement | Thai | Arab |
| Minimum | 0.85% | 0.94% |
| Maximum | 24.1% | 72.7% |
| Range | 23.3% | 71.8% |
| Mean | 8.2% | 23.4% |
| Median | 7.3% | 18.1% |
| Interquartile 25% (IQ1) | 4.5% | 14.3% |
| Interquartile 75% (IQ3) | 10.6% | 28.4% |
| Interquartile Range (IQR) | 6.1% | 14.2% |
| Standard Deviation (Sample) | 4.6% | 14.5% |
| Standard Deviation (Population) | 4.6% | 14.4% |
Similar Demographics by Child Poverty Under the Age of 5
Demographics Similar to Thais by Child Poverty Under the Age of 5
In terms of child poverty under the age of 5, the demographic groups most similar to Thais are Immigrants from Hong Kong (12.4%, a difference of 1.0%), Immigrants from Singapore (12.9%, a difference of 5.1%), Filipino (11.6%, a difference of 6.0%), Chinese (13.1%, a difference of 6.1%), and Iranian (13.1%, a difference of 6.1%).
| Demographics | Rating | Rank | Child Poverty Under the Age of 5 |
| Immigrants | India | 100.0 /100 | #1 | Exceptional 11.5% |
| Immigrants | Taiwan | 100.0 /100 | #2 | Exceptional 11.6% |
| Filipinos | 100.0 /100 | #3 | Exceptional 11.6% |
| Thais | 100.0 /100 | #4 | Exceptional 12.3% |
| Immigrants | Hong Kong | 100.0 /100 | #5 | Exceptional 12.4% |
| Immigrants | Singapore | 100.0 /100 | #6 | Exceptional 12.9% |
| Chinese | 100.0 /100 | #7 | Exceptional 13.1% |
| Iranians | 100.0 /100 | #8 | Exceptional 13.1% |
| Immigrants | Iran | 100.0 /100 | #9 | Exceptional 13.1% |
| Burmese | 100.0 /100 | #10 | Exceptional 13.2% |
| Immigrants | Korea | 100.0 /100 | #11 | Exceptional 13.2% |
| Immigrants | South Central Asia | 100.0 /100 | #12 | Exceptional 13.3% |
| Bhutanese | 100.0 /100 | #13 | Exceptional 13.4% |
| Okinawans | 100.0 /100 | #14 | Exceptional 13.4% |
| Indians (Asian) | 100.0 /100 | #15 | Exceptional 13.4% |
Demographics Similar to Arabs by Child Poverty Under the Age of 5
In terms of child poverty under the age of 5, the demographic groups most similar to Arabs are Immigrants from Germany (17.4%, a difference of 0.030%), Lebanese (17.4%, a difference of 0.040%), Hawaiian (17.4%, a difference of 0.080%), South American Indian (17.4%, a difference of 0.080%), and Immigrants from Costa Rica (17.4%, a difference of 0.18%).
| Demographics | Rating | Rank | Child Poverty Under the Age of 5 |
| Immigrants | Lebanon | 47.6 /100 | #175 | Average 17.3% |
| Immigrants | Iraq | 45.2 /100 | #176 | Average 17.3% |
| Immigrants | Sierra Leone | 43.6 /100 | #177 | Average 17.3% |
| Immigrants | Cameroon | 42.7 /100 | #178 | Average 17.4% |
| Hawaiians | 41.5 /100 | #179 | Average 17.4% |
| South American Indians | 41.4 /100 | #180 | Average 17.4% |
| Immigrants | Germany | 41.0 /100 | #181 | Average 17.4% |
| Arabs | 40.7 /100 | #182 | Average 17.4% |
| Lebanese | 40.3 /100 | #183 | Average 17.4% |
| Immigrants | Costa Rica | 39.0 /100 | #184 | Fair 17.4% |
| Immigrants | Armenia | 38.0 /100 | #185 | Fair 17.5% |
| Immigrants | Bosnia and Herzegovina | 35.0 /100 | #186 | Fair 17.5% |
| Kenyans | 34.7 /100 | #187 | Fair 17.5% |
| Carpatho Rusyns | 33.6 /100 | #188 | Fair 17.5% |
| French | 33.6 /100 | #189 | Fair 17.5% |