Immigrants from Micronesia vs Luxembourger Child Poverty Under the Age of 5
COMPARE
Immigrants from Micronesia
Luxembourger
Child Poverty Under the Age of 5
Child Poverty Under the Age of 5 Comparison
Immigrants from Micronesia
Luxembourgers
19.4%
CHILD POVERTY UNDER THE AGE OF 5
0.9/ 100
METRIC RATING
234th/ 347
METRIC RANK
14.9%
CHILD POVERTY UNDER THE AGE OF 5
99.4/ 100
METRIC RATING
53rd/ 347
METRIC RANK
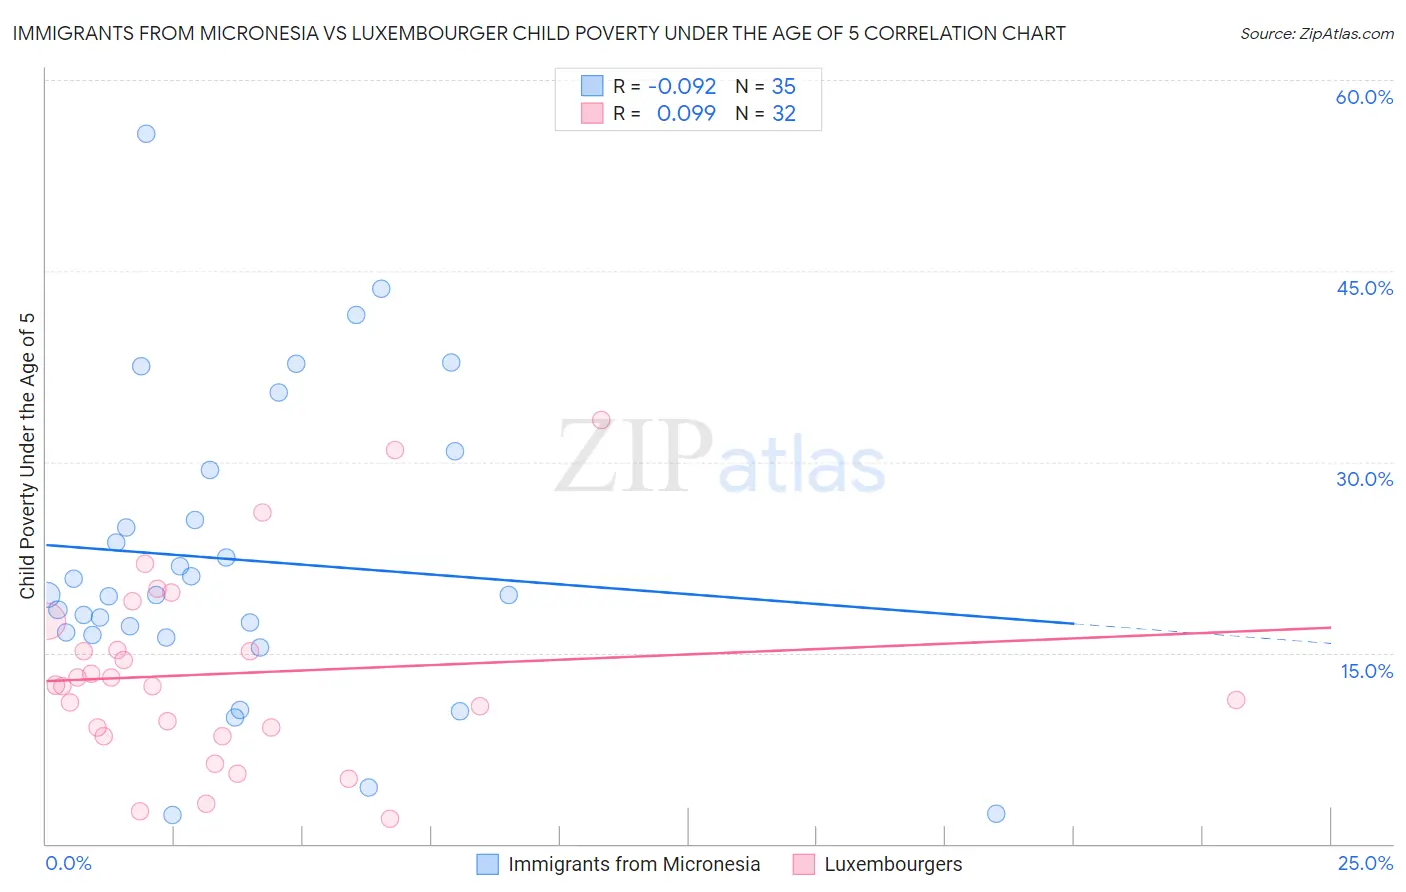
Immigrants from Micronesia vs Luxembourger Child Poverty Under the Age of 5 Correlation Chart
The statistical analysis conducted on geographies consisting of 61,294,346 people shows a slight negative correlation between the proportion of Immigrants from Micronesia and poverty level among children under the age of 5 in the United States with a correlation coefficient (R) of -0.092 and weighted average of 19.4%. Similarly, the statistical analysis conducted on geographies consisting of 141,046,176 people shows a slight positive correlation between the proportion of Luxembourgers and poverty level among children under the age of 5 in the United States with a correlation coefficient (R) of 0.099 and weighted average of 14.9%, a difference of 29.8%.
Child Poverty Under the Age of 5 Correlation Summary
| Measurement | Immigrants from Micronesia | Luxembourger |
| Minimum | 2.3% | 2.0% |
| Maximum | 55.8% | 33.3% |
| Range | 53.5% | 31.4% |
| Mean | 22.3% | 13.4% |
| Median | 19.5% | 12.5% |
| Interquartile 25% (IQ1) | 16.4% | 8.8% |
| Interquartile 75% (IQ3) | 29.4% | 16.3% |
| Interquartile Range (IQR) | 12.9% | 7.6% |
| Standard Deviation (Sample) | 11.9% | 7.5% |
| Standard Deviation (Population) | 11.7% | 7.4% |
Similar Demographics by Child Poverty Under the Age of 5
Demographics Similar to Immigrants from Micronesia by Child Poverty Under the Age of 5
In terms of child poverty under the age of 5, the demographic groups most similar to Immigrants from Micronesia are Sudanese (19.3%, a difference of 0.12%), Trinidadian and Tobagonian (19.3%, a difference of 0.18%), Immigrants from Laos (19.4%, a difference of 0.21%), Immigrants from Trinidad and Tobago (19.4%, a difference of 0.21%), and Bermudan (19.2%, a difference of 0.74%).
| Demographics | Rating | Rank | Child Poverty Under the Age of 5 |
| Cape Verdeans | 1.4 /100 | #227 | Tragic 19.1% |
| Immigrants | Sudan | 1.3 /100 | #228 | Tragic 19.2% |
| Ghanaians | 1.2 /100 | #229 | Tragic 19.2% |
| Ecuadorians | 1.2 /100 | #230 | Tragic 19.2% |
| Bermudans | 1.2 /100 | #231 | Tragic 19.2% |
| Trinidadians and Tobagonians | 0.9 /100 | #232 | Tragic 19.3% |
| Sudanese | 0.9 /100 | #233 | Tragic 19.3% |
| Immigrants | Micronesia | 0.9 /100 | #234 | Tragic 19.4% |
| Immigrants | Laos | 0.8 /100 | #235 | Tragic 19.4% |
| Immigrants | Trinidad and Tobago | 0.8 /100 | #236 | Tragic 19.4% |
| Immigrants | Cabo Verde | 0.6 /100 | #237 | Tragic 19.5% |
| Salvadorans | 0.6 /100 | #238 | Tragic 19.5% |
| Vietnamese | 0.6 /100 | #239 | Tragic 19.5% |
| Immigrants | Ecuador | 0.5 /100 | #240 | Tragic 19.6% |
| Alaska Natives | 0.5 /100 | #241 | Tragic 19.6% |
Demographics Similar to Luxembourgers by Child Poverty Under the Age of 5
In terms of child poverty under the age of 5, the demographic groups most similar to Luxembourgers are Immigrants from Israel (14.9%, a difference of 0.0%), Danish (14.9%, a difference of 0.070%), Immigrants from Pakistan (14.9%, a difference of 0.14%), Immigrants from Serbia (14.9%, a difference of 0.17%), and Egyptian (14.9%, a difference of 0.22%).
| Demographics | Rating | Rank | Child Poverty Under the Age of 5 |
| Tsimshian | 99.6 /100 | #46 | Exceptional 14.7% |
| Russians | 99.6 /100 | #47 | Exceptional 14.8% |
| Immigrants | Czechoslovakia | 99.6 /100 | #48 | Exceptional 14.8% |
| Immigrants | Bulgaria | 99.6 /100 | #49 | Exceptional 14.8% |
| Immigrants | Northern Europe | 99.6 /100 | #50 | Exceptional 14.8% |
| Estonians | 99.6 /100 | #51 | Exceptional 14.8% |
| Immigrants | Serbia | 99.5 /100 | #52 | Exceptional 14.9% |
| Luxembourgers | 99.4 /100 | #53 | Exceptional 14.9% |
| Immigrants | Israel | 99.4 /100 | #54 | Exceptional 14.9% |
| Danes | 99.4 /100 | #55 | Exceptional 14.9% |
| Immigrants | Pakistan | 99.4 /100 | #56 | Exceptional 14.9% |
| Egyptians | 99.4 /100 | #57 | Exceptional 14.9% |
| Swedes | 99.4 /100 | #58 | Exceptional 15.0% |
| Paraguayans | 99.4 /100 | #59 | Exceptional 15.0% |
| Immigrants | Russia | 99.3 /100 | #60 | Exceptional 15.0% |