Immigrants from Mexico vs Yuman Single Mother Poverty
COMPARE
Immigrants from Mexico
Yuman
Single Mother Poverty
Single Mother Poverty Comparison
Immigrants from Mexico
Yuman
34.0%
SINGLE MOTHER POVERTY
0.0/ 100
METRIC RATING
308th/ 347
METRIC RANK
37.8%
SINGLE MOTHER POVERTY
0.0/ 100
METRIC RATING
335th/ 347
METRIC RANK
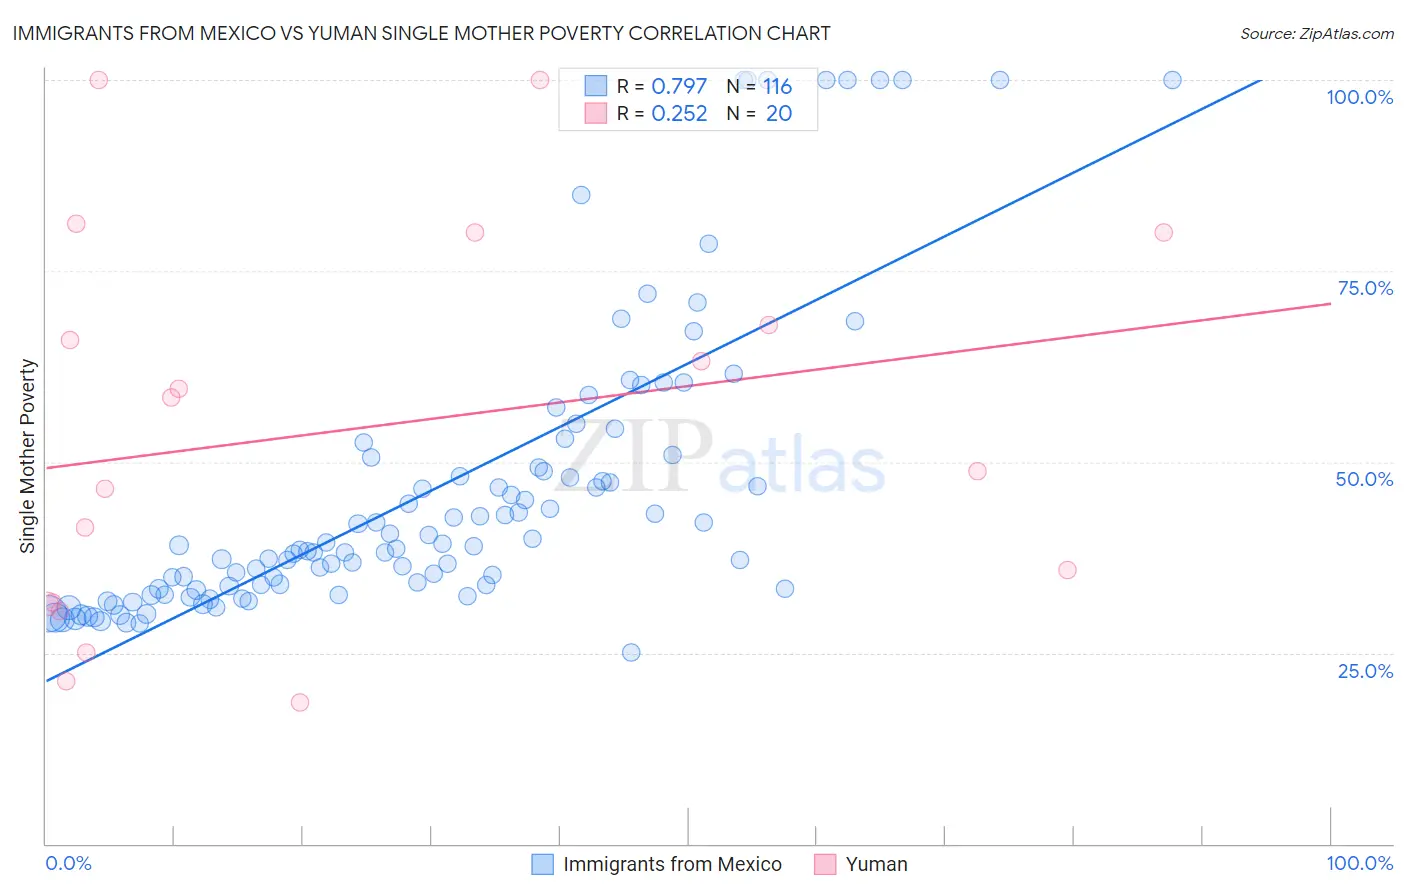
Immigrants from Mexico vs Yuman Single Mother Poverty Correlation Chart
The statistical analysis conducted on geographies consisting of 497,741,826 people shows a strong positive correlation between the proportion of Immigrants from Mexico and poverty level among single mothers in the United States with a correlation coefficient (R) of 0.797 and weighted average of 34.0%. Similarly, the statistical analysis conducted on geographies consisting of 40,528,655 people shows a weak positive correlation between the proportion of Yuman and poverty level among single mothers in the United States with a correlation coefficient (R) of 0.252 and weighted average of 37.8%, a difference of 11.1%.
Single Mother Poverty Correlation Summary
| Measurement | Immigrants from Mexico | Yuman |
| Minimum | 25.0% | 18.5% |
| Maximum | 100.0% | 100.0% |
| Range | 75.0% | 81.5% |
| Mean | 46.2% | 54.4% |
| Median | 38.8% | 53.5% |
| Interquartile 25% (IQ1) | 33.4% | 31.5% |
| Interquartile 75% (IQ3) | 49.9% | 74.0% |
| Interquartile Range (IQR) | 16.5% | 42.5% |
| Standard Deviation (Sample) | 19.4% | 25.2% |
| Standard Deviation (Population) | 19.3% | 24.6% |
Similar Demographics by Single Mother Poverty
Demographics Similar to Immigrants from Mexico by Single Mother Poverty
In terms of single mother poverty, the demographic groups most similar to Immigrants from Mexico are Comanche (33.9%, a difference of 0.18%), Potawatomi (34.1%, a difference of 0.42%), Immigrants from Congo (33.8%, a difference of 0.60%), Honduran (34.2%, a difference of 0.64%), and Alsatian (34.3%, a difference of 0.95%).
| Demographics | Rating | Rank | Single Mother Poverty |
| Immigrants | Somalia | 0.0 /100 | #301 | Tragic 33.4% |
| Arapaho | 0.0 /100 | #302 | Tragic 33.4% |
| Americans | 0.0 /100 | #303 | Tragic 33.5% |
| Mexicans | 0.0 /100 | #304 | Tragic 33.6% |
| Immigrants | Central America | 0.0 /100 | #305 | Tragic 33.6% |
| Immigrants | Congo | 0.0 /100 | #306 | Tragic 33.8% |
| Comanche | 0.0 /100 | #307 | Tragic 33.9% |
| Immigrants | Mexico | 0.0 /100 | #308 | Tragic 34.0% |
| Potawatomi | 0.0 /100 | #309 | Tragic 34.1% |
| Hondurans | 0.0 /100 | #310 | Tragic 34.2% |
| Alsatians | 0.0 /100 | #311 | Tragic 34.3% |
| Central American Indians | 0.0 /100 | #312 | Tragic 34.3% |
| Immigrants | Dominican Republic | 0.0 /100 | #313 | Tragic 34.4% |
| Chickasaw | 0.0 /100 | #314 | Tragic 34.4% |
| Hopi | 0.0 /100 | #315 | Tragic 34.5% |
Demographics Similar to Yuman by Single Mother Poverty
In terms of single mother poverty, the demographic groups most similar to Yuman are Pueblo (37.2%, a difference of 1.5%), Menominee (37.1%, a difference of 1.9%), Cheyenne (38.5%, a difference of 1.9%), Immigrants from Yemen (38.5%, a difference of 2.0%), and Pima (38.6%, a difference of 2.2%).
| Demographics | Rating | Rank | Single Mother Poverty |
| Choctaw | 0.0 /100 | #328 | Tragic 36.4% |
| Apache | 0.0 /100 | #329 | Tragic 36.6% |
| Natives/Alaskans | 0.0 /100 | #330 | Tragic 36.6% |
| Creek | 0.0 /100 | #331 | Tragic 36.7% |
| Dutch West Indians | 0.0 /100 | #332 | Tragic 36.8% |
| Menominee | 0.0 /100 | #333 | Tragic 37.1% |
| Pueblo | 0.0 /100 | #334 | Tragic 37.2% |
| Yuman | 0.0 /100 | #335 | Tragic 37.8% |
| Cheyenne | 0.0 /100 | #336 | Tragic 38.5% |
| Immigrants | Yemen | 0.0 /100 | #337 | Tragic 38.5% |
| Pima | 0.0 /100 | #338 | Tragic 38.6% |
| Crow | 0.0 /100 | #339 | Tragic 38.6% |
| Sioux | 0.0 /100 | #340 | Tragic 38.8% |
| Colville | 0.0 /100 | #341 | Tragic 39.3% |
| Navajo | 0.0 /100 | #342 | Tragic 40.2% |