Immigrants from Mexico vs Peruvian Single Mother Poverty
COMPARE
Immigrants from Mexico
Peruvian
Single Mother Poverty
Single Mother Poverty Comparison
Immigrants from Mexico
Peruvians
34.0%
SINGLE MOTHER POVERTY
0.0/ 100
METRIC RATING
308th/ 347
METRIC RANK
27.5%
SINGLE MOTHER POVERTY
99.2/ 100
METRIC RATING
76th/ 347
METRIC RANK
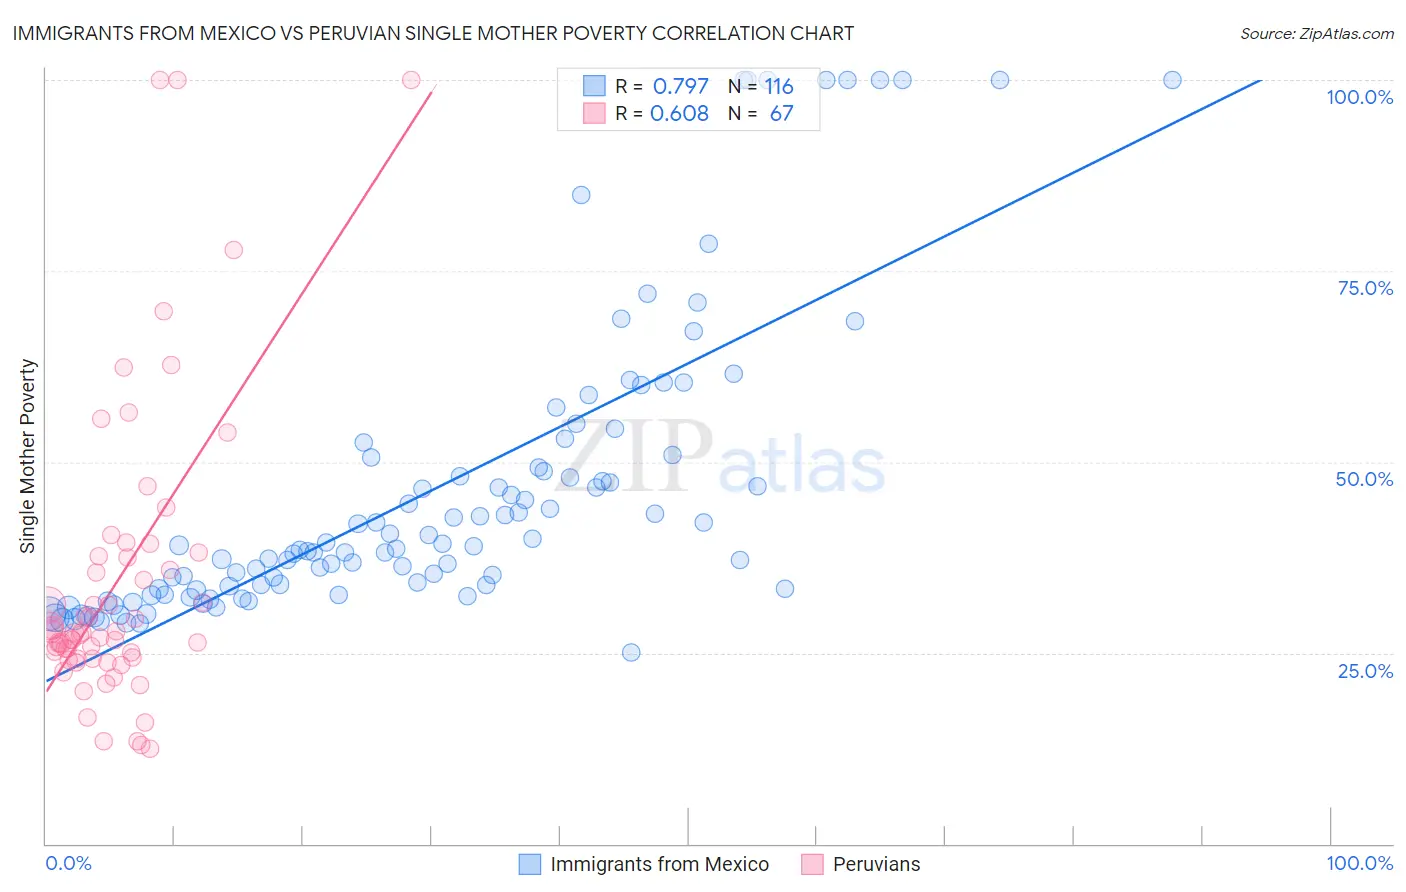
Immigrants from Mexico vs Peruvian Single Mother Poverty Correlation Chart
The statistical analysis conducted on geographies consisting of 497,741,826 people shows a strong positive correlation between the proportion of Immigrants from Mexico and poverty level among single mothers in the United States with a correlation coefficient (R) of 0.797 and weighted average of 34.0%. Similarly, the statistical analysis conducted on geographies consisting of 355,516,377 people shows a significant positive correlation between the proportion of Peruvians and poverty level among single mothers in the United States with a correlation coefficient (R) of 0.608 and weighted average of 27.5%, a difference of 23.6%.
Single Mother Poverty Correlation Summary
| Measurement | Immigrants from Mexico | Peruvian |
| Minimum | 25.0% | 12.4% |
| Maximum | 100.0% | 100.0% |
| Range | 75.0% | 87.6% |
| Mean | 46.2% | 34.3% |
| Median | 38.8% | 27.6% |
| Interquartile 25% (IQ1) | 33.4% | 24.2% |
| Interquartile 75% (IQ3) | 49.9% | 37.7% |
| Interquartile Range (IQR) | 16.5% | 13.4% |
| Standard Deviation (Sample) | 19.4% | 19.4% |
| Standard Deviation (Population) | 19.3% | 19.2% |
Similar Demographics by Single Mother Poverty
Demographics Similar to Immigrants from Mexico by Single Mother Poverty
In terms of single mother poverty, the demographic groups most similar to Immigrants from Mexico are Comanche (33.9%, a difference of 0.18%), Potawatomi (34.1%, a difference of 0.42%), Immigrants from Congo (33.8%, a difference of 0.60%), Honduran (34.2%, a difference of 0.64%), and Alsatian (34.3%, a difference of 0.95%).
| Demographics | Rating | Rank | Single Mother Poverty |
| Immigrants | Somalia | 0.0 /100 | #301 | Tragic 33.4% |
| Arapaho | 0.0 /100 | #302 | Tragic 33.4% |
| Americans | 0.0 /100 | #303 | Tragic 33.5% |
| Mexicans | 0.0 /100 | #304 | Tragic 33.6% |
| Immigrants | Central America | 0.0 /100 | #305 | Tragic 33.6% |
| Immigrants | Congo | 0.0 /100 | #306 | Tragic 33.8% |
| Comanche | 0.0 /100 | #307 | Tragic 33.9% |
| Immigrants | Mexico | 0.0 /100 | #308 | Tragic 34.0% |
| Potawatomi | 0.0 /100 | #309 | Tragic 34.1% |
| Hondurans | 0.0 /100 | #310 | Tragic 34.2% |
| Alsatians | 0.0 /100 | #311 | Tragic 34.3% |
| Central American Indians | 0.0 /100 | #312 | Tragic 34.3% |
| Immigrants | Dominican Republic | 0.0 /100 | #313 | Tragic 34.4% |
| Chickasaw | 0.0 /100 | #314 | Tragic 34.4% |
| Hopi | 0.0 /100 | #315 | Tragic 34.5% |
Demographics Similar to Peruvians by Single Mother Poverty
In terms of single mother poverty, the demographic groups most similar to Peruvians are Immigrants from Peru (27.5%, a difference of 0.020%), Immigrants from North Macedonia (27.5%, a difference of 0.030%), Immigrants from Sweden (27.5%, a difference of 0.040%), Immigrants from Italy (27.5%, a difference of 0.070%), and Taiwanese (27.5%, a difference of 0.070%).
| Demographics | Rating | Rank | Single Mother Poverty |
| Lithuanians | 99.4 /100 | #69 | Exceptional 27.4% |
| Immigrants | Belarus | 99.4 /100 | #70 | Exceptional 27.4% |
| Macedonians | 99.4 /100 | #71 | Exceptional 27.4% |
| Immigrants | Russia | 99.4 /100 | #72 | Exceptional 27.4% |
| Sierra Leoneans | 99.3 /100 | #73 | Exceptional 27.4% |
| Immigrants | Europe | 99.3 /100 | #74 | Exceptional 27.4% |
| Immigrants | Sweden | 99.2 /100 | #75 | Exceptional 27.5% |
| Peruvians | 99.2 /100 | #76 | Exceptional 27.5% |
| Immigrants | Peru | 99.2 /100 | #77 | Exceptional 27.5% |
| Immigrants | North Macedonia | 99.2 /100 | #78 | Exceptional 27.5% |
| Immigrants | Italy | 99.1 /100 | #79 | Exceptional 27.5% |
| Taiwanese | 99.1 /100 | #80 | Exceptional 27.5% |
| Immigrants | Scotland | 98.9 /100 | #81 | Exceptional 27.6% |
| Immigrants | Cameroon | 98.8 /100 | #82 | Exceptional 27.6% |
| Greeks | 98.7 /100 | #83 | Exceptional 27.7% |