Hungarian vs Yuman Single Mother Poverty
COMPARE
Hungarian
Yuman
Single Mother Poverty
Single Mother Poverty Comparison
Hungarians
Yuman
29.9%
SINGLE MOTHER POVERTY
10.3/ 100
METRIC RATING
218th/ 347
METRIC RANK
37.8%
SINGLE MOTHER POVERTY
0.0/ 100
METRIC RATING
335th/ 347
METRIC RANK
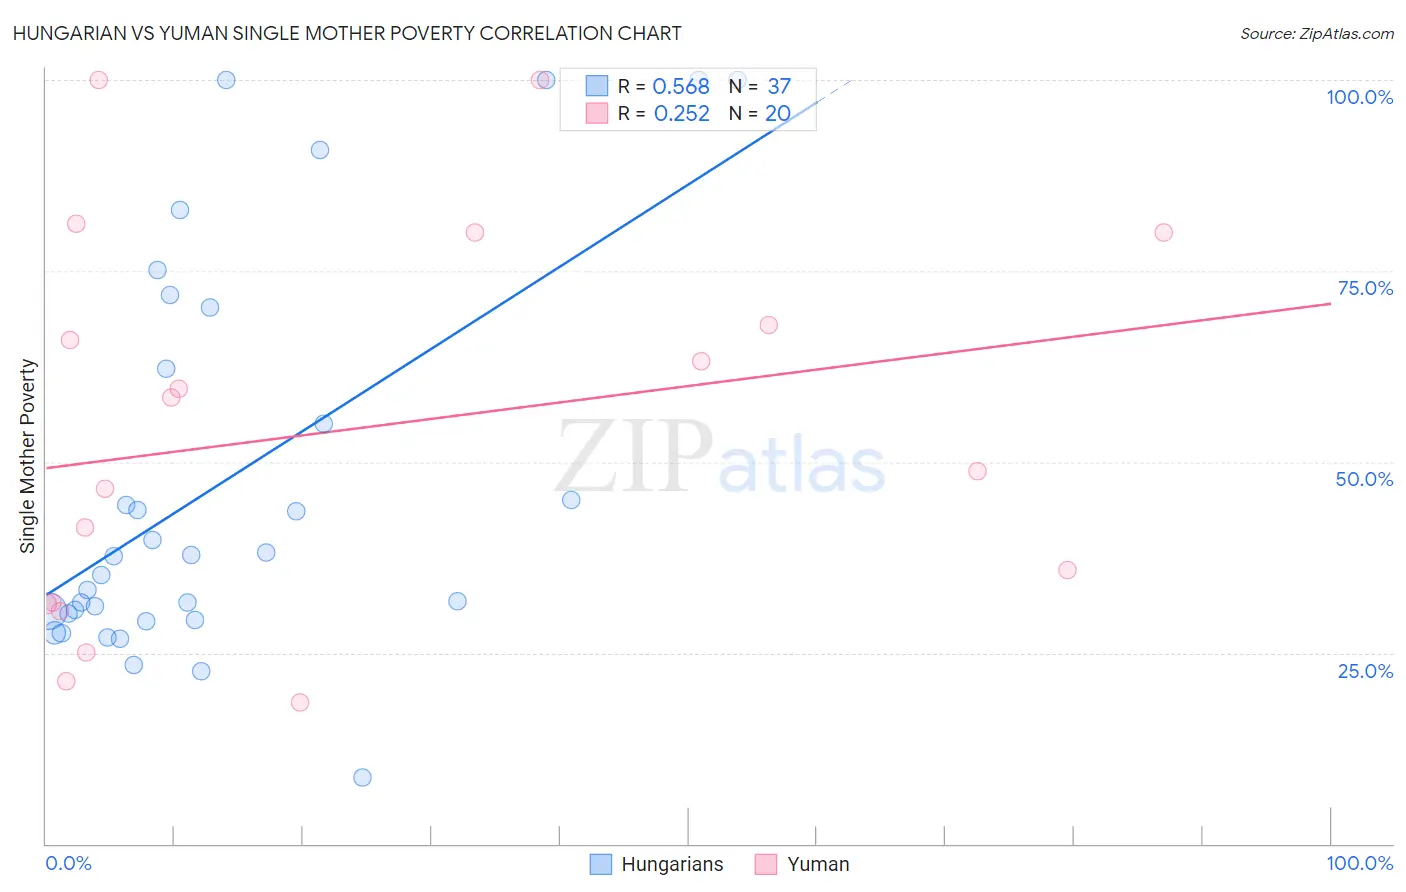
Hungarian vs Yuman Single Mother Poverty Correlation Chart
The statistical analysis conducted on geographies consisting of 467,495,531 people shows a substantial positive correlation between the proportion of Hungarians and poverty level among single mothers in the United States with a correlation coefficient (R) of 0.568 and weighted average of 29.9%. Similarly, the statistical analysis conducted on geographies consisting of 40,528,655 people shows a weak positive correlation between the proportion of Yuman and poverty level among single mothers in the United States with a correlation coefficient (R) of 0.252 and weighted average of 37.8%, a difference of 26.2%.
Single Mother Poverty Correlation Summary
| Measurement | Hungarian | Yuman |
| Minimum | 8.6% | 18.5% |
| Maximum | 100.0% | 100.0% |
| Range | 91.4% | 81.5% |
| Mean | 47.2% | 54.4% |
| Median | 37.6% | 53.5% |
| Interquartile 25% (IQ1) | 29.7% | 31.5% |
| Interquartile 75% (IQ3) | 66.3% | 74.0% |
| Interquartile Range (IQR) | 36.6% | 42.5% |
| Standard Deviation (Sample) | 25.8% | 25.2% |
| Standard Deviation (Population) | 25.5% | 24.6% |
Similar Demographics by Single Mother Poverty
Demographics Similar to Hungarians by Single Mother Poverty
In terms of single mother poverty, the demographic groups most similar to Hungarians are Immigrants from Ghana (29.9%, a difference of 0.12%), Immigrants from Western Africa (29.9%, a difference of 0.14%), Finnish (30.0%, a difference of 0.14%), Liberian (29.9%, a difference of 0.16%), and Jamaican (29.9%, a difference of 0.16%).
| Demographics | Rating | Rank | Single Mother Poverty |
| Guyanese | 12.8 /100 | #211 | Poor 29.8% |
| Nicaraguans | 12.4 /100 | #212 | Poor 29.8% |
| Immigrants | Thailand | 12.0 /100 | #213 | Poor 29.9% |
| Liberians | 11.7 /100 | #214 | Poor 29.9% |
| Jamaicans | 11.7 /100 | #215 | Poor 29.9% |
| Immigrants | Western Africa | 11.5 /100 | #216 | Poor 29.9% |
| Immigrants | Ghana | 11.3 /100 | #217 | Poor 29.9% |
| Hungarians | 10.3 /100 | #218 | Poor 29.9% |
| Finns | 9.3 /100 | #219 | Tragic 30.0% |
| Germans | 8.8 /100 | #220 | Tragic 30.0% |
| Immigrants | Eritrea | 7.7 /100 | #221 | Tragic 30.0% |
| Sudanese | 7.6 /100 | #222 | Tragic 30.0% |
| Immigrants | Cuba | 6.9 /100 | #223 | Tragic 30.1% |
| Immigrants | Sudan | 6.5 /100 | #224 | Tragic 30.1% |
| Spanish | 6.3 /100 | #225 | Tragic 30.1% |
Demographics Similar to Yuman by Single Mother Poverty
In terms of single mother poverty, the demographic groups most similar to Yuman are Pueblo (37.2%, a difference of 1.5%), Menominee (37.1%, a difference of 1.9%), Cheyenne (38.5%, a difference of 1.9%), Immigrants from Yemen (38.5%, a difference of 2.0%), and Pima (38.6%, a difference of 2.2%).
| Demographics | Rating | Rank | Single Mother Poverty |
| Choctaw | 0.0 /100 | #328 | Tragic 36.4% |
| Apache | 0.0 /100 | #329 | Tragic 36.6% |
| Natives/Alaskans | 0.0 /100 | #330 | Tragic 36.6% |
| Creek | 0.0 /100 | #331 | Tragic 36.7% |
| Dutch West Indians | 0.0 /100 | #332 | Tragic 36.8% |
| Menominee | 0.0 /100 | #333 | Tragic 37.1% |
| Pueblo | 0.0 /100 | #334 | Tragic 37.2% |
| Yuman | 0.0 /100 | #335 | Tragic 37.8% |
| Cheyenne | 0.0 /100 | #336 | Tragic 38.5% |
| Immigrants | Yemen | 0.0 /100 | #337 | Tragic 38.5% |
| Pima | 0.0 /100 | #338 | Tragic 38.6% |
| Crow | 0.0 /100 | #339 | Tragic 38.6% |
| Sioux | 0.0 /100 | #340 | Tragic 38.8% |
| Colville | 0.0 /100 | #341 | Tragic 39.3% |
| Navajo | 0.0 /100 | #342 | Tragic 40.2% |